🆓Yearn.Finance/USDT Analysis (27/1) #YFI $YFIYFI is in a correction to $22-23k zone, which is a good buy zone and we can expect a strong rally to $32k, $44k and even $65k in February.
📈BUY
-Buy: 22k-23k$. SL B
📉SELL
-Sell: 32k-33k$. SL A
-Sell: 43k-45k$. SL A
-Sell: 65k-67k$. SL A
♻️BACK-UP
-Sell: 22k-23k$ if B. SL A
-Buy: 16k-17k$. SL B
-Buy: 32k-33k$ if A. SL B
❓Details
Condition A : "If 1D candle closes ABOVE this zone"
Condition B : "If 1D candle closes BELOW this zone"
YFIUSD

YFI/USD - Trying its luck at $36k!YFI has found some good support on the ascending wedge and we seem keen to push higher to $36k.
We have some resistance before that is feasible, so let's see if we can pass the dotted diagonal which serves as immediate resistance.
Indicators on 4h are looking good to me, therefore short term bias is bullish. ETH and BTC also managed to hold at support and reverse higher, which is bullish, at least for now. See my ideas below for that.
Like and follow if you liked this idea!

DOUBLE-TOP GRAPHIC STANDARD CONFIRMED! AND NOW? DAILY YFIBUSDTechnical analysis regarding the price of YEARN FINANCE in relation of dollar Binance for the next scenarios, based on daily movement.
The price has formed a double top chart pattern, already shrinking and is reaching the uptrend line to test it! The price has been moving upward, making funds / upwards, and the 34-period EMA is driving the price. However, the SAR Parabolic is in a downward movement, which I believe will end after there is a stagnation in this correction. (If the double-top pattern is concrete, the tendency is for the price to fall! But I believe in this cryptocurrency and well, the price will be able to seek the projected bullish targets (green lines) and continue with the valuation! it's a good one!
disclaimer
*** This is not a recommendation to purchase and/or sale. It is for educational purposes only. ***


YFIUSDT middle lineI will keep my eyes on the blue line , if it becomes resistance this is a good short signal , if there is going out of bounds up then a good long signal

YFI subtle triangleDebatable if this larger triangle exists, but I believe it is there. PA trying to breakout of it now but currently there is deep bearish divergences. Measured move of the large triangle is 74k.

YFI/USD - At critical support - will it hold?YFI is in a critical spot in the larger pattern testing the ascending support line and previous top support line.
If we fall from here, then we're going much lower. Next support levels are on the chart at $25k and $21k.
Unfortunately the daily indicators are not encouraging, both MACD and RSI can fall much more.
Unless we get some nice buy pressure soon, I don't see how YFI can last another drop from BTC / overall market. Nevertheless, if that happens the first support line is not that far down.
Unless we get some buy pressure soon, I do not recommend buying here, wait for price to give more signs of reversal.
Like and follow if you liked this idea!

YFI / Final analysis 2021.01.21Final analysis: The trend will be determined in a few hours. Given that BTC dominance is being maintained, we are probably nearing the end of the market downturn and the uptrend will begin in another hour. In this diagram, three possible trends are identified.
Red, green and white arrows

YFI UPDATE 2021.01.19If the candle is closed above bb --> 60,000$ , the upward trend will continue and it can be achieved in 4 models with different colors.
If the candle is closed above 60,000 bb, the upward trend will continue and it can be achieved in 4 models with different colors.
The chart is a bit confusing but it will be a climb in summary, you can check and analyze the trend by choosing any color.


YFI / USDT - Ascending UpdateAscending Update - I hope this chart follows
Thoroughly checked and checked in all indicators, signs of ascent are evident.


YFI confirmedH&S breakout some days back and retest appears to be holding. Idea is to add to longs <30k with orange line defining stop loss. Target $144k.
This trade idea is for entertainment purposes only and is not intended as a recommendation to buy.

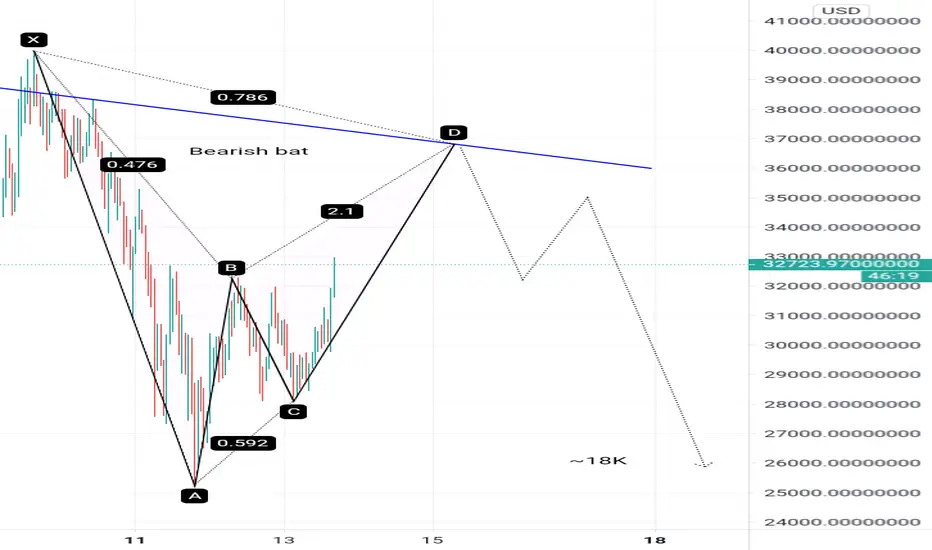
YFI-4h. Buyers have a chance to test $ 43,000.A few steps were not enough for YFI buyers to test the historical high. After a grueling price consolidation at $30,000 , buyers were able to set a new local high of $39,930.
Of course, this is good news. However, after 50 days of consolidation , buyers managed to grow by only 50% . If you look at the dynamics of YFI price growth from November 5 to 19, it becomes clear that buyers do not have enough strength for a new aggressive wave of growth.
The YFI price has tested the upper trend line of the wedge , in which the price has been trading since the beginning of November. Buyers are now trying to consolidate above the previous strong level of $30,000.
If buyers fail to break the $43,000 mark , the probability of a reversal of the growth trend and the test of the $20,800-22,000 range will increase significantly.
The global level that YFI holds remains unchanged at $18,000 . Continuing the downward wave in the BTC market to the $26,000 mark will help YFI sellers test this mark. The situation is tense. You need to be extremely careful:
__________________________________
We create both short-term ideas (for a local understanding of the market situation) and medium-term forecasts of price movements.
Subscribe to us and get daily concise analytics!


YFI/USD - Finding support before next push towards ATH YFI corrected like all the crypto market and is now finding support just around $30k or Fib 61.8%. We may drop another leg down towards $27k but that is uncertain now.
Regardless if we find support at 30k or 27k we have a good chance to see YFI making another strong leg up towards ATH as indicated by the chart.
The indicators are looking good and momentum has not been lost, thus my bias remains bullish once we confirm the support level from above.
Aim to long the support levels, a good target is 36k and then ATH level.
Like and follow if you liked this idea!

YFIUSDT(Waiting for the resistance zone breakout)#YFIUSDT ( 1H chart) Technical Analysis Update
Waiting for the Resistance zone BreakouT
YFI/USDT currently trading at $31400
Long Entry-level: Above $32800 (Enter long after 1 h candle closes above the resistance level at $32800)
STOP LOSS: I will update once I see the breakout
Reisstance level 1 (Target 1): $35600
Resistance level 2 (Target 2): $39200
Max leverage: 3X
ALWAYS KEEP STOP LOSS..
Follow our Tradingview Account for more Technical Analysis Update, | Like, Share and Comment your thoughts.

YFIUSDT - Potential retracement 🔽YFI brokeout as expected from my previous analysis.
Price is testing the projected ascending channel resistance.
RSI is printing a bearish divergence signal.
Price action is printing a rising wedge pattern.
Sell entry ⬇️ - breakdown below the rising wedge support.
Targets 🎯 - flip horizontal support / fibonacci retracement levels / ascending channel support.
Setup invalidation ❌ - breakout above the ascending channel resistance.

✳️Yearn.Finance/USDT Analysis (25/12) #YFI $YFIYFI has rallied sharply from 18k$ zone as our previous analysis, however the buying force is not so strong that it needs more time to prove its upside.
I think it succeeds in re-retesting 22k$ zone to continue up to 27k$ and up to 40k$ in January. This is a very strong zone and the possibility of a breakout is not high.
📈BUY
-Buy: 22k-23k$. SL B
📉SELL
-Sell: 38k-40k$. SL A
♻️BACK-UP
-Sell: 22k-23k$ if B. SL A
-Buy: 16k-17k$. SL B
-Sell: 16k-17k$ if B. SL A
❓Details
Condition A : "If 1D candle closes ABOVE this zone"
Condition B : "If 1D candle closes BELOW this zone"
