$uni is writing its own story In my experience even the most hyped alt coins took their time to accumulate. The question is if $uni will range from here or wants to dip even more. This new hyper hyped DeFi coins promise so much hope they deliver.
Yield

BNB - Renewed Life? Nearing buy for 70%+ potential?BNB is Binance's native coin. A useful coin as it is used for a variety of transactions on Binance, and allows traders lower trading fees by using it for fees, as well as yield options.
I've had a love hate relationship with this coin in the external world: On one hand, it's uses on what is essentially the most popular exchange has meant constant demand. On the other hand, it's directly tied to an exchange; and as history has told us, these seemingly mighty titans can be felled relatively quickly.
Recently it's seen a huge uptick following the September dump, largely driven by it's inclusion in various liquidity farming pools. Big returns, allegedly minimal risk! Allegedly .
Taking a look at the chart, I think there's some potential here.
Since the June '19 ATH, we've seen a bearish downward channel turn into a rather bullish upward channel. Higher highs, higher lows, rather consistently strong MACD. It's the things you want to see.
EMA 100 is a very important trendline on the BNB daily chart. We can see the price basically play around it: Above it, 100 becomes support and the price is bullish. Below it, 100 becomes resistance the we see bearish movement. Currently we are above it with a recent test bringing aggressive price rebounding.
MACD is showing decently bearish at the moment, can assume further drops in the short term as historically the bearish MACD trends take a few days to play out with BNB
Stoch is bottoming out. Historically it doesn't hang out here long at all, with abrupt up shifts being the norm recently.
If we stay above this line consistently, without regular testing , I think bullish action in general can be assumed for BNB .
Also, notice support & resistance levels have been falling in line with fib levels often, with the current support being at .5 fib, almost scarily on the nose. Like wise peaks fall on the fib. This can tell us ALOT about how the general market is reading the chart and setting their levels.
BUYING IN?
We're close. If the long term ascending channel holds we'll likely have a good opportunity to buy soon. Short term we're facing a bit of a resistance wall since the last peak, a break through this could signal movement upward. My buy zone is from 22.30 down to around .382 fib or 19.11 in the cases of a total market breakdown. Don't see it falling below this point, as that would take it well beyond previous lows and completely break the bullish upward channel it's been on. Definitely stop loss territory.
BUYIN: 22.20 down to 18.00
TP's: (based on previous highs, and fib levels)
#1 - 27.05
#2 - 32.70
#3 - 39.90
SL: 15-20% MAX
If all else fails, we stick em in a yield pool and pray that boat isn't headed to the proverbial waterfall. Am I joking or not? Your call!
“On the highest throne in the world, we still sit only on our own bottom.” - Michel de Montaigne
I'm a guy that you don't know posting his ideas on the internet for the sake of improving as a human being. If you take this as financial advice, that's on you.
Feedback, criticism and crude humor are welcome :)

RidetheMacro| US-10 Year Treasury Yield | 40 years Outlook📌 Treasury yields move higher ahead of Fed speeches.
U.S. government debt prices fell on Friday morning as investors monitored rising cases of coronavirus and polls ahead of the U.S. election.
the yield on the benchmark 10-year Treasury note rose above 📈 1% to trade at 0.6904%. The yield on the 30-year Treasury bond increased 📈 by about 78 basis points to trade at 1.4375%. Yields move inversely to prices.
US-10 Year Treasury Yield - 40 Years in Review
📍 Many of still remember the collapse of the U.S. housing market in 2006 and the ensuing financial crisis that wreaked havoc on the U.S. and around the world. Financial crises are, unfortunately, quite common in history and often cause economic tsunamis in affected economies.
⬇️ Below I explain some Major Financial Crisis.
📍 1981 Volcker Fund Rate Increase
Paul Volcker was Chair of the Federal Reserve from 1979 to 1987. In 1980, the Volcker Shock raised the fed funds rate to its highest point in history to end double-digit inflation. That extreme and prolonged interest rate rise was called the Volcker Shock. It did end inflation
📍 The Credit Crisis of 1772
This crisis originated in London and quickly spread to the rest of Europe. In the mid-1760s the British 🇬🇧 Empire had accumulated an enormous amount of wealth through its colonial possessions and trade. This created an aura of over optimism and a period of rapid credit expansion by many British banks 🏦. The hype came to an abrupt end on June 8, 1772, when Alexander Fordyce—one of the partners of the British banking house Neal, James, Fordyce, and Down—fled to France to escape his debt repayments. The news quickly spread and triggered a banking panic in England 🏴, as creditors began to form long lines in front of British banks to demand instant cash withdrawals. The ensuing crisis rapidly spread to Scotland, the Netherlands, other parts of Europe, and the British 🇬🇧 American colonies. Historians have claimed that the economic repercussions of this crisis were one of the major contributing factors to the Boston Tea Party protests and the American Revolution.
📍 The Great Depression of 1929–39
This was the worst financial and economic disaster of the 20th century. Many believe that the Great Depression was triggered by the Wall Street crash of 1929 and later exacerbated by the poor policy decisions of the U.S. government 🇺🇸. The Depression lasted almost 10 years and resulted in massive loss of income, record unemployment rates, and output loss, especially in industrialized nations. In the United States the unemployment rate hit almost 25 percent at the peak of the crisis in 1933.
📍 The OPEC Oil Price Shock of 1973
This crisis began when OPEC (Organization of the Petroleum Exporting Countries) member countries—primarily consisting of Arab nations—decided to retaliate against the United States in response to its sending arms supplies to Israel during the Fourth Arab–Israeli War. OPEC countries declared an oil embargo, abruptly halting oil exports to the United States and its allies. This caused major oil shortages and a severe spike in oil prices and led to an economic crisis in the U.S 🇺🇸. and many other developed countries. What was unique about the ensuing crisis was the simultaneous occurrence of very high inflation (triggered by the spike in energy prices) and economic stagnation (due to the economic crisis). As a result, economists named the era a period of “stagflation” (stagnation plus inflation), and it took several years for output to recover and inflation to fall to its pre crisis levels.
📍 The Asian Crisis of 1997
This crisis originated in Thailand in 1997 and quickly spread to the rest of East Asia and its trading partners. Speculative capital flows from developed countries to the East Asian economies of Thailand 🇹🇭, Indonesia 🇮🇩, Malaysia 🇲🇾, Singapore 🇸🇬, Hong Kong 🇭🇰, and South Korea 🇰🇷 (known then as the “Asian tigers”) had triggered an era of optimism that resulted in an overextension of credit and too much debt accumulation in those economies. In July 1997 the Thai government had to abandon its fixed exchange rate against the U.S. dollar 💲 that it had maintained for so long, citing a lack of foreign currency resources. That started a wave of panic across Asian financial markets and quickly led to the widespread reversal of billions of dollars of foreign investment. As the panic unfurled in the markets and investors grew wary of possible bankruptcies of East Asian governments, fears of a worldwide financial meltdown began to spread. It took years for things to return to normal. The International Monetary Fund had to step in to create bailout packages for the most-affected economies to help those countries avoid default.
📍 The dotcom bubble
The dotcom bubble, also known as the internet bubble, was a rapid rise in U.S. technology stock equity valuations fueled by investments in internet-based companies during the bull market in the late 1990s. During the dotcom bubble, the value of equity markets grew exponentially, with the technology-dominated Nasdaq index rising from under 1,000 to more than 5,000 between the years 1995 and 2000. In 2001 and through 2002 the bubble burst, with equities entering a bear market.
The crash that followed saw the Nasdaq index, which had risen five-fold between 1995 and 2000, tumble from a peak of 5,048.62 on March 10, 2000, to 1,139.90 on Oct 4, 2002, a 76.81% fall. By the end of 2001, most dotcom stocks had gone bust. Even the share prices of blue-chip technology stocks like Cisco, Intel and Oracle lost more than 80% of their value. It would take 15 years for the Nasdaq to regain its dotcom peak, which it did on April 23, 2015.
📍 The Financial Crisis of 2007–08
This sparked the Great Recession, the most-severe financial crisis since the Great Depression, and it wreaked havoc in financial markets around the world. Triggered by the collapse of the housing bubble in the U.S., the crisis resulted in the collapse of Lehman Brothers (one of the biggest investment banks 🏦in the world), brought many key financial institutions and businesses to the brink of collapse, and required government bailouts of unprecedented proportions. It took almost a decade for things to return to normal, wiping away millions of jobs and billions of dollars of income along the way.

RidetheMacro| NZD 10 Year Yield📌 New Zealand 10Y Bond Yield.
Like, subscribe and leave your comments below! 🤝
Until next time,
Ride the macro

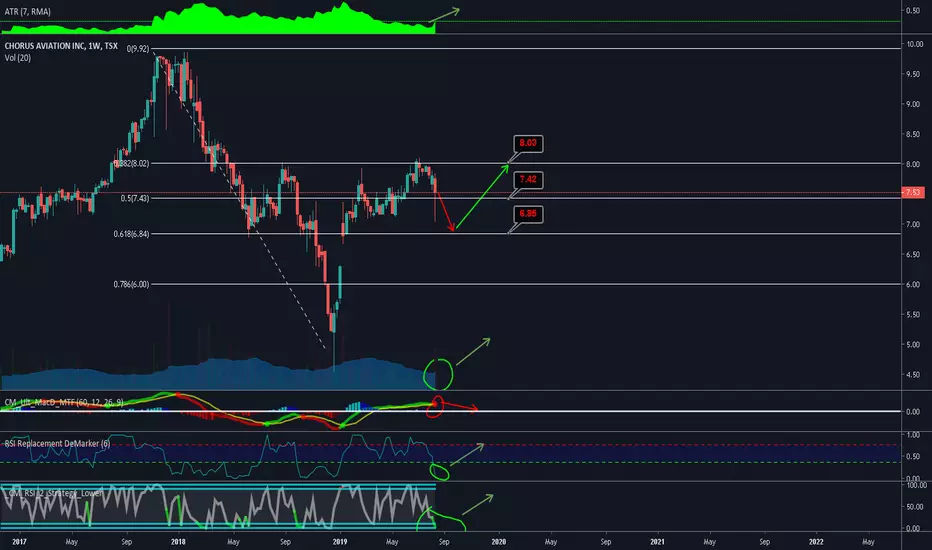
Yield play with potentialHigh Yield stock with an extended deal with Air Canada. This will probably draw investers with fear of a drop in the markets over the next year. I expect some ranging between $6.85 and $8 but has potential to be a "Safe Haven" for yield seekers. 55% Payout Ratio with a steady dividend for the past 13 years. Calculation of the Graham Number shows it valued around $7.91 and is on the border of a defensive value stock. Currently trading at a discount in my mind.
Bonds slipping away (bearish indicator crossover)The cross is using the 20 and 50 exponential moving average .
Every time the shorter exponential moving average crosses the longer one, this indicates a bearish signal.
You can see the times this has worked in the past, in the same chart.

LEND + YFI + CRV | Levels for DeFi Yield Farming Tokens 🌾🚜🐄💬 Any cross-section of DeFi will look good due to yield farmer FOMO. However, some serious projects like LENDUSDT, YFIUSDT, CRVUSDT look especially good to us from both a TA and FA standpoint.
Yield farmers can utilize LEND's AAVE platform to farm Curve's yCRV using YFI Vaults. Meanwhile, while Curve's current chart looks a bit like how do you say 💩, the underlying Curve technology is interesting, and thus at least some of those farming yields may want to be aware of support and resistance levels not only for LEND and YFI, but for Curve as well (even if only to maximize gains from yields).
Hit that 👍 button to show support for the content!
Help the community grow by giving us a follow 🐣
-----
LENDUSDT
Support:
S1: The S/R Flip range is where the most bullish of bulls will hope to find support. There is no rule that says LEND needs to consolidate more or test lower support before running. This DeFi gem is hot and could keep moving.
S2: Sure S1 is nice, but for a healthy uptrend there is no better support for bulls than the S2 S/R and orderblock range. This range would offer just the right amount of consolidation and could even result in a move right off the trend line.
S3: A quick wick down to the S/R and orderblock cluster if S2 doesn't hold also makes sense. We lose bullish market structure below this, so look for S3 to save us if things get shakey.
YFIUSDT
Support:
S1: There is only one logical place to look for support for YFI, that is this orderblock cluster at the bottom of the consolidation range. Not like other support can't be found, but one doesn't want to see too much retracement after such a run.
Resistance:
R1: The S/R flip at the previous swing high is our first resistance point.
R2: If the bulls can take R1, then the orderblock range at the previous high is our last point of resistance before YFI's price starts putting BTC to shame.
CRVUSDT
Support:
S1: People are farming CRV and dumping it, striping VC Curve holders of their natural resource (value). That said, bears better hope the farmers can dump below the S1 orderblock range, because there is some solid support there and the more it is tested and holds, the more it looks like a potential bottom.
Resistance:
R1: Everyone is likely to take profits at the orderblock at the previous high, so watch for resistance here.
R2: A break above R1 means an uptrend could be in the works, it would be wise to look for a pullback at the S/R flip range here and consolidation on R1.
-----
Summary:
People are rushing into LEND and YFI to farm coins like CRV. As long as that gambit is playing out, we should see the current trends continue. Given that, we want to look for entries in LEND and YFI at support and cautiously dump our CRV crops at resistance. That said, Curve has some potential as an FA play, so it may be worth watching for how it reacts at support and resistance before fully dismissing it.
Resources:
defiprime.com
✨ Drop a comment letting us know what you think of this down below! ✨

YFI - DeFi world is crazyTotally madness, YFI token price is almost like BTC. Thanks to Yearn Finance and a lot of yield farmers token price is mooning. I thought it was overvalued at $4000 but I don't even know what to think now. Call me crazy but I think this bubble may continue to inflate while liquidity in Yearn Finance pools continue to grow.
Hit the "LIKE" button and follow to support, thank you!
Information is just for educational purposes, never financial advice. Always do your own research.

US10Y seems like it is on its way upCould this be the time that the long-term yields will start to rise in the US?
It looks like it from a technical view. RSI and MACD are both pointing towards an upward turn.

COMP painting a nice Bullish Divergence COMP has been one of the few DeFi coins to really not have a nice run so far. Granted it started off insanely priced above $300, this nice divergence on the RSI is looking good and as long as BTC doesn't do anything crazy I think there is some good upside here.


$ET - The dividend is confirmed and the yield is massive Institutional investors may have been selling and shorting Energy Transfer. Their mistake can make you a great return quickly.
The dividend has been confirmed providing a massive yield
The tax treatment of domestic energy limited partnerships can provide a massive benefit
This stock is extremely under valued

July 18 Market Update | Technical, Fundamental, NewsDescription:
An analysis for the week ahead.
Points of Interest:
S&P $3,200 Balance; February Gap; Nasdaq Weakness, Russell and Dow Strength.
Technical:
Broad-market equity indices balanced higher last week, evidenced by the responsive, tight trading range.
Recapping last week’s action, on Monday, the S&P 500 gapped higher, outside of a prior balance area, but failed to continue, rotating back into the prior week’s range. Tuesday’s session continued Monday’s selling activity, but reversed just short of the prior balance area low.
After news that Moderna Inc’s (NASDAQ: MRNA) COVID-19 coronavirus vaccine produced antibodies, Wednesday’s session saw prices pushing higher, gapping beyond Tuesday’s range. Buyers attempted to burst through the resting liquidity at $3,230, but failed with prices later following the Nasdaq’s relative weakness lower to close the overnight gap. After some mixed economic data, Thursday's session was dominated by responsive activity, balancing out near Wednesday’s v-bottom low, with sellers lacking conviction the most via the minimal excess low. Alongside monthly options expiry, Friday’s session continued Thursday’s tone with the intraday trading range remaining tight and responsive.
Looking beyond broad market indices, the innovation-driven, technology-based sectors are showing signs of relative weakness, while other sectors, such as industrials, energy, and financials are rotating higher off recent support.
Overall, the market is in a 3-day balance that it’s likely to break, come next week. Positive news regarding a vaccine, earnings, and stimulus may help further squeeze shorts as we look to fill the gap above, left from late February.
Scroll to bottom of document for non-profile charts.
Key Events:
Earnings; Existing-Home Sales; New-Home Sales; Initial Claims. tmsnrt.rs
Fundamental:
Airline industry demand projected to surpass 2019 levels in 2023. bit.ly AMEX:JETS
Travel industry seeks government assistance, tax breaks to spur trips. reut.rs
Rocket Companies expects profit to surge ahead of the U.S. IPO. reut.rs
Canadian wholesale trade posts largest jump in 17 years. reut.rs
Flight to suburbs boosts homebuilding as consumer sentiment fades. reut.rs
Europe meets on Recovery and Resilience Facility agreement. bit.ly
60% or large firms with sales over $2 billion expect growth to accelerate. bit.ly
The U.S. ended Hong Kong’s special status to punish China. bloom.bg
Applications for new home purchases rose 54.1% from a year ago. bit.ly
Options on the Micro E-Mini S&P 500 and Nasdaq-100 to arrive August, 31. bit.ly
84% of PPP loan recipients will exhaust funding by the first week of August. bit.ly
63% of small business owners say less than 75% of their revenue has returned. bit.ly
$64 billion invested in North American startups, down 10% year-to-date. bit.ly
Nasdaq optimism hits dangerous levels as tech becomes an attractive hedge. bit.ly
$40-per-barrel not a sufficient clearing price for leveraged shale producers. bit.ly
China bank lending hits record $1.72 trillion in first half after solid June. reut.rs
Dominion Energy Inc (NYSE: D) to sell gas assets, cancel pipeline. bit.ly NYSE:D
U.S. withdraws some underwriting requirements, a positive for payday lenders. bit.ly
Increase in transactions suggests a rebound in Russia’s economy. bit.ly
Acquisition of National General increases Allstate Corp’s (NYSE: ALL) leverage. bit.ly NYSE:ALL
U.K. actions to buoy employment and businesses, mitigate prolonged shock. bit.ly
Moderna Inc’s (NASDAQ: MRNA) vaccine elicited coronavirus antibodies. bloom.bg NASDAQ:MRNA
Corporate credit quality improved in the week ending July 15. bit.ly
U.S. and China tech cold war could cost the sector more than $3.5 trillion. bit.ly
Canada is poaching tech talent from the U.S. via Express Entry program. bit.ly
China shows economic recovery with 3.2% GDP growth in Q2. bit.ly
U.S. manufacturing increased for the second month, by 5.4%. on.wsj.com
The jobs market is poised to reverse May and June gains. bit.ly
Charles Schwab Corporation (NYSE: SCHW) made less money despite adding assets. bit.ly NYSE:SCHW
Coronavirus surge sparks worries over renewed lockdowns, global fuel demand. reut.rs
China’s bull run could signal a Wall Street stampede. bit.ly
Cuomo confirms New York City will enter the final phase of reopening Monday. on.mktw.net
Brazil to allow citizens to withdraw from pension funds early. reut.rs
Ally Financial Inc (NYSE: ALLY) delinquencies, charge-offs of auto loans improve. on.wsj.com NYSE:ALLY
Hospitals may be falsely labeling COVID-19 coronavirus deaths. bit.ly
Underwriting to come down according to JPMorgan Chase & Co (NYSE: JPM). bloom.bg NYSE:JPM
Copper-to-gold ratio suggests rates should be higher than they currently are. bloom.bg
Sentiment: 30.8% Bullish, 23.8% Neutral, 45.4% Bearish as of 7/18/2020. bit.ly
Gamma Exposure: (Trending Lower) 2,257,721,540 as of 7/18/2020. bit.ly
Dark Pool Index: (Trending Lower) 45.8% as of 7/18/2020. bit.ly
Product Analysis:
S&P 500 (ES):
Nasdaq 100 (NQ):
Russell 2000 (RTY):
Gold (GC):
Crude Oil (CL):
Treasury Bonds (ZB):
Disclaimer:
This is a page where I look to share knowledge and keep track of trades. If questions, concerns, or suggestions, feel free to comment. I think everyone can improve, especially me.
In no way should this post be construed as investment advice.

US Dollar Index & RatesThis circular relationship is leaving many analysts puzzled as to what's next for the Dollar. Weight of the evidence points to a lower Dollar for now.
A truly weak US Dollar means the clocks ticking on the current bull market in Bonds and subsequently the upward trend in equities.


ETH looking to flip Month long range ETH is testing and looking to flip where it has been ranging for almost the entire month of June from a technical standpoint. If we can flip and retest this level I feel comfortable opening a long position here.
The current defi craze is also making me lean very bullish as everything runs on ETH so some of that value will be captured no doubt with people seemingly hurrying to the space and the ETH network being very very active in recent weeks...
Something to keep an eye on.


FEDERAL RESERVE PREP -- 0.75% Key level in US 10-YEAR YIELDBond yields have broken out beyond 0.75% - coming just shy of 1% - 0.75$ is now support
The Fed could try to stop yields moving higher in its decision today by new policies including:
1. Yield Curve Control (YCC) - or
2. Forward Guidance

JP10Y - downtrend aheadJP10Y seems to have finished minute wave 2 and the next move should be minute 3 of minor 3. Minor 3 should decline yields to around -0.17. If yield crosses up 0.03 this analysis should be reviewed. FOLLOW SKYLINEPRO TO GET UPDATES.

The Best Yield Curve Tutorial You've Ever ReadThe two year has remained relatively flat since this week's open. However it did gap up significantly. Why is the 30 year falling (see linked article) while the two year remains consistent?
Bonds of different maturities care about different things. In particular, the shorter end of the spectrum cares less about the long term effects of inflation and the general position in the economic cycle than the long end. Why? Those effects will be felt less in two years than the short term effects of interest rate decisions or the sentiment about it.
Conversely, the 30 year has more time to price in these factors. It has to take in the considerations above, and more. Hence why the 30 year is tumbling right now, as it's more sensitive to risk sentiment and longer term factors.
Don't forget that bonds are fixed income products, meaning they pay a yield that is inversely proportional to the price. The difference between the yield at either end of the spectrum is commonly referred to as the yield curve . The yield curve could also refer to a plot of the set of all yields on treasury products of various maturities.
The difference between the two ends could narrow, or flatten . It could also steepen . Furthermore, that flattening or steepening could be driven by either end. In this case it is led by the long end. Since prices are decreasing (on account of risk on sentiment), we call this a long end led bear steepener .
If you liked this analysis, subscribe for more content. Also check us out at Ghost Squawk!

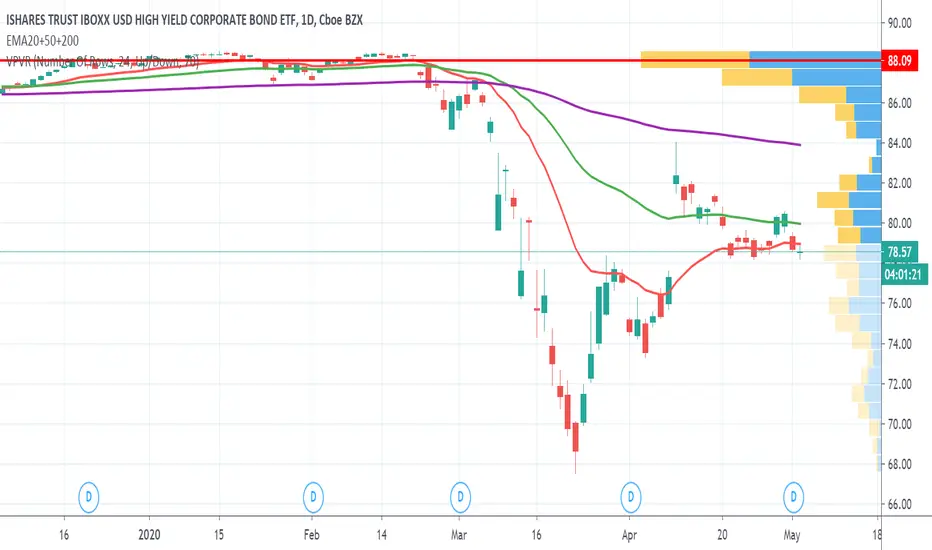
Fed high-yield buying might inflate the price somewhatThe prices of high-yield bond ETFs went through the roof after the Fed announced that it would be buying them, but they came back down as investors realized that the central bank hasn't actually purchased any yet. Word on the Street is that they're about to start, though, so I went ahead and picked up a couple May 15 calls, and we'll see what happens.
Here's the prospectus on the program, which says the Fed will buy junk-grade bonds with 7-to-1 leverage: www.newyorkfed.org
I kind of hate myself for buying this garbage with all the bankruptcies and default risk out there, but the market seems to be mostly an index of central bank stimulus right now, so... when in Rome. (I'm keeping my bet small and would not recommend anyone throw a lot of money at this.)
US10YJust doing a bit of analysis and you can all see what I think I've found, so this begs the question is the bottom in on stock market?
And if yes the market has in fact bottomed WTF is going to happen in 2-3 years from now?
