Bitcoin, SPX, Ethereum, Tesla: Whats Next? BTC appears to be showing distribution signs.
I do believe BTC local top is in, but alt coins like Ethereum can still push a bit higher.
Ethereum short around 3900-4000 looks promising
Tesla fell sharply on the back of cash flow burn and expenditures.
Investors are also fearful of sales decline and loss of EV credits.
SPX hit major long term resistance today. Coupling this with a depressed Vix we are likely setting up for a pullback in the market.
Small caps saw distribution today on the back of rising yields. A failed breakout observed on IWM chart.
Yields

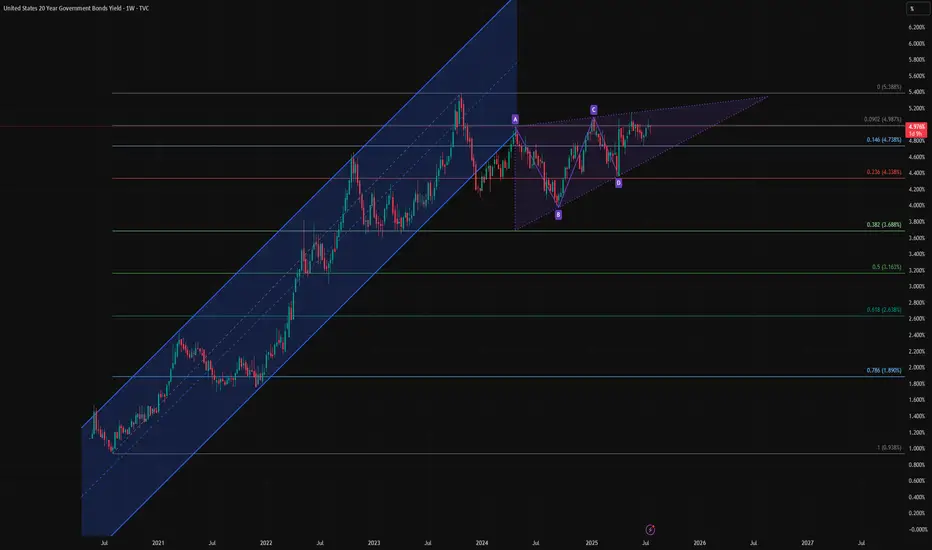
Bond Bulls Smell Blood: 20-Year Yields Likely to Fall🧩 Fundamental Bear Case for 20-Year Yields
1. Recession Risk and Slowing Growth
Leading economic indicators (e.g., ISM Manufacturing, Conference Board LEI) continue to suggest softening demand across key sectors.
A recession or significant slowdown would drive capital into long-duration Treasuries, causing yields to fall as bond prices rise.
Historically, 20-year yields fall 200–300bps from cycle peaks during recessions. With yields near 5%, there is ample downside room.
2. Federal Reserve Policy Pivot
The Fed’s hiking cycle appears to be at or near its terminal point. Rate cuts in 2025 are increasingly priced in, especially as inflation moderates.
If inflation continues to decelerate toward the Fed’s 2% target while growth slows, the Fed may be forced to ease sooner or more aggressively than expected.
Long-duration bonds, including the 20Y, are highly sensitive to forward rate expectations and would benefit from a dovish pivot.
3. Disinflationary Trends
Core inflation metrics (e.g., Core PCE, Core CPI) are in year-over-year decline.
Key disinflationary forces:
Wage pressures have eased as labor markets normalize.
Housing costs, which lag in CPI data, are projected to fall further.
Supply chain normalization continues post-COVID.
These factors reduce the need for elevated long-term yields, especially with inflation expectations anchored.
4. Supply-Demand Dynamics Favor Treasuries
Despite large Treasury issuance, global demand remains strong:
Foreign buyers (e.g., Japan, EU) seek higher yields as their home rates remain low or negative.
U.S. institutions (pensions, insurance funds) are rebalancing into risk-free long bonds amid equity volatility.
A risk-off rotation or broader de-leveraging cycle would only accelerate this demand.
🔍 Technical Summary
Rising wedge pattern is nearing a potential breakdown — a bearish structure signaling exhaustion.
Price is failing to reclaim the previous uptrend channel, now acting as resistance.
A completed harmonic AB=CD pattern near recent highs suggests a mean-reverting move could be imminent.
Closest technical targets include:
4.33% (23.6% Fib)
3.68% (38.2% Fib)
Possibly even 3.16% (50% retracement) over the next 6–12 months if macro weakness persists.
📌 Bottom Line
The combination of:
Cooling inflation
A Fed pivot on the horizon
Rising recession risk
And technical exhaustion signals
Supports a bearish outlook for 20-year yields, meaning bond prices (especially long-duration instruments like TMF or TLT) could appreciate meaningfully from here.
US10Y Big downside potentialThe U.S. Government Bonds 10YR Yield (US10Y) has been since last week on a 1D MA50 (blue trend-line) rebound, consistently rising since the April 04 Low (Support 1). The presence of the Lower Highs trend-line just above it, puts strong selling pressure long-term.
As a result, either now or upon a Lower Highs contact, we expect the US10Y to turn bearish and Target 3.860% (Support 1).
-------------------------------------------------------------------------------
** Please LIKE 👍, FOLLOW ✅, SHARE 🙌 and COMMENT ✍ if you enjoy this idea! Also share your ideas and charts in the comments section below! This is best way to keep it relevant, support us, keep the content here free and allow the idea to reach as many people as possible. **
-------------------------------------------------------------------------------
💸💸💸💸💸💸
👇 👇 👇 👇 👇 👇

SPY, SPX, IWM, Natural Gas, NVDA, XYZ, AI - Analysis- Markets sold off into the NVDA rally this morning.
- Small afternoon rally turned indices back green
- Major pre market high levels up ahead likely allow us to push higher in coming days.
- NVDA should retest its premarket high levels.
- Profits secured on AI calls!
- Structurally indices are still bullish and remain above key levels.
- Yields see nasty reversal lower and look to be going down.
- Natural Gas trying to lure investors with a bottoming tail - but i think its false hope.

The Ultra Idea : d-MR96nBa's Ultimate Market Journal🌌The Ultra Idea : d-MR96nBa's🌠Ultimate Market Journal🎨
Hello Fellow Travelers
It's been some time since I've posted a Fresh Idea, though I've remained actively trading.
What better way to mark my TradView return, than to start an Ultimate Market Journal.
Financial Markets have taken my deep interest again recently, especially as we seem to be at a time of accelerating change and shifting regimes.
I believe many opportunities abound to those with open, flexible and creative minds.
A bit more about myself.
I've been involved with financial markets in one form or fashion for 18 years now.
I started out like most of us, approaching the game with fundamental analysis, only to later incorporate and then fully graduate to T/A.
I'm a natural Contrarian.
My brand of technical analysis is as much about aesthetics, creative expression, discovering hidden truths and applying Universal Principles as it is running the numbers.
I'm starting this off with Ultra Bond Futures, as UB's are the trading instrument I've come to specialise in, having had the most ongoing consistent success trading.
This by no means is going to be a "I bought here and sold there" type of Journal, as that's not my style.
Nor am I going to focus on a single market instrument, observation or style of analysis.
I'd like this to become a repository of accumulated wisdom and unique market perceptives.
I've just begun contemplating what this may evolve into in time, and I invite you to join me in taking this Leap
d-MR96nBa🌌
Concept
Inversion📈📉
Seek out and analyse whatever moves exactly inverse to what you intend to trade.
If you're having trouble discerning trend or observing price patterns, check the inverse.
This can be an excellent technique for exposing Bias.
This can work particularly well for currency traders, though can be Universally applied.
For US Ultra Bonds, the inverse is the US 30 Year Yield
Ultra Bond Futures
US 30 Year Yield
Currency traders, say you're about to trade AUD/CHF
Check out the CHF/AUD chart first, if they both appear Bullish or Bearish, you've got a Bias.
AUD/CHF
CHF/AUD
GBP/JPY
JPY/GBP
EUR/USD
USD/EUR
Are there any examples of Inversion in Trading you'd like to share ?
What else is on my🧠
Well just casually, I believe we're currently witnessing Peak Bitcoin in it's entire Life-cycle.
Have we Bull Trapped & Breakaway Gapped on Berkshire Hathaway
BRK.B
It's in the Detail

Bond Yields moving soonSo, we redrew the trendlines a few days ago and this is where the 10Yr currently stands.
Bond Yields should give some sort of direction within the next handful of days. Be ready.
TVC:TNX
Interest Rates

HTZ short idea?NASDAQ:HTZ HTZ is underperformjng the market In a large way today.
With interest rates falling & the IWM rallying to the upside this is a bearish divergence occurring for this ticker.
If HTZ can't rally with the positive conditions it likely means this stock will continue to see some selling pressure.
Understand this is a high risk high flying stock that can have outsized moves.

The 10 Year: When Should We Worry?All over the media eyes are on yields but what exactly do the different potential rates of the 10-year yield mean in terms of debt servicing for the United States? I made this chart to visualize the danger points.
I am not saying I think we will get there I just wanted to know myself and help others to understand what each pain point can mean to the United States economy.

Bond Yields Ripping, Will Wall Street Take Notice?Rising yields can usually be associated with a period of risk on. But seeing the 30-year treasury yield rise over 20bp in Asia while Wall Street futures cling on to their cycle lows is anything but usual. In fact, it's a bad omen of things to come.
Matt Simpson, Market Analyst at City Index and Forex.com

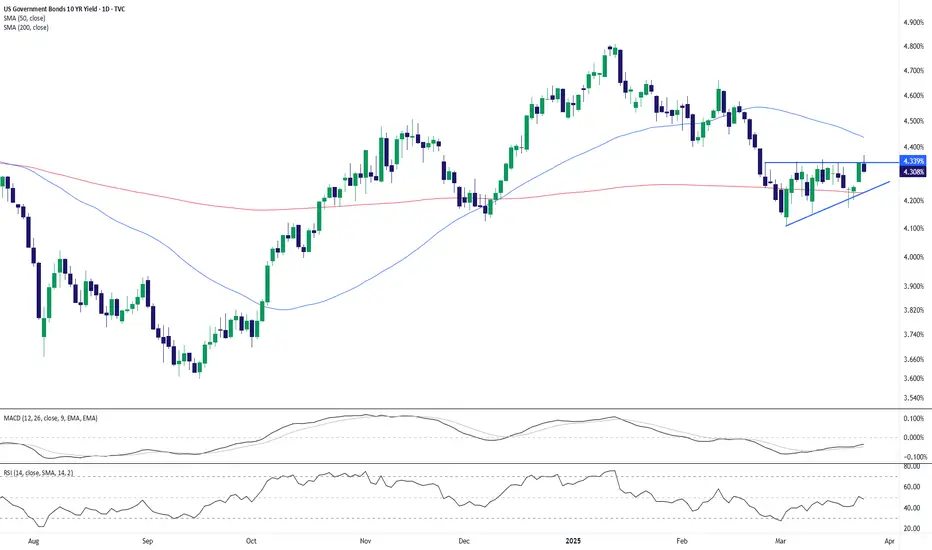
US 10yr Treasury Yields Press Against ResistanceThe U.S. 10-year Treasury yield is hovering just beneath the 4.34% resistance level, with price forming a tight ascending triangle just under this key level. Today’s pullback to 4.31% (-0.74%) suggests hesitation from bulls as momentum indicators turn mixed.
🔹 MACD is flat, showing a lack of directional conviction.
🔹 RSI sits at 47.94, neutral and non-committal.
🔹 Price remains sandwiched between the 50-day SMA (4.43%) and the 200-day SMA (4.22%).
A confirmed breakout above 4.34% could open the door for a run toward 4.50% or even 4.80%. Conversely, a drop below the rising trendline (~4.24%) would expose downside risk toward the 200-day SMA.
Watch for a catalyst (Fed commentary or inflation data) to break the deadlock.
-MW
Credit Spreads - About to Blow?While credit spreads, which reached near-historic lows in 2024, remain tight, they have widened notably since the beginning of 2025. If this trend accelerates, it could put substantial pressure on the bond market, resulting in tighter financial conditions and corresponding headwinds for the domestic economy. The last 2-3 weeks have seen risk assets come under pressure, but the below chart suggests that the risk-off sentiment shift may still be early-stage... Whether viewed through a traditional technical lens or supply/demand, current levels could be considered supportive - risk is to the upside.
A few impacted ETFs: NASDAQ:IEF , NASDAQ:TLT , AMEX:HYG , AMEX:JNK
Jon
JHartCharts

US10Y Strong sell signal below the 1D MA50.The U.S. Government Bonds 10YR Yield (US10Y) has been trading within a Channel Down since the October 23 2023 High. In the past 2 months it has been on a downtrend, which is the technical Bearish Leg of the pattern.
The 1D MACD is on its 2nd Bullish Cross on a decline, very similar with the previous Bearish Leg of the Channel Down. We are again on the 0.5 Fibonacci level and as long as any rebound gets rejected below or on the 1D MA50 (blue trend-line), the long-term bearish pattern remains intact.
We expect a similar Bearish Leg of -24% overall to target 3.685%.
-------------------------------------------------------------------------------
** Please LIKE 👍, FOLLOW ✅, SHARE 🙌 and COMMENT ✍ if you enjoy this idea! Also share your ideas and charts in the comments section below! This is best way to keep it relevant, support us, keep the content here free and allow the idea to reach as many people as possible. **
-------------------------------------------------------------------------------
💸💸💸💸💸💸
👇 👇 👇 👇 👇 👇

relief pumpSeems like election bull was already priced in, new money got washed.
Bonds are making a comeback, cash is a position.
Expecting more downturn after a relief pump, coinciding with yields retracement.
Yields trending with equity price are usually signs of either economical expansion or economical fears, such as slowdown or recession, during up and downs. The markets just jumped from one narrative to the other:
expansion(trump gets in office) ---> slowdown(tariffs imposed)
I think the expansion narrative will take a while to settle back(end of Q2 at least) after all the executive orders signed.
Although, I'm still long for the month of March, nice opportunity for a relief pump, before resuming of slowdown narrative.

EUR/USD keeps rolling after ECB rate cutThe euro has posted strong gains on Friday after taking a pause a day earlier. EUR/USD is trading at 1.0858 in the European session, up 0.69% on the day. It's been a remarkable week for the euro, which has soared 4.7% against the US dollar.
The ECB lowered rates by 25 basis points on Thursday in a widely-expected decision. This brings the deposit rate to 2.5%, its lowest level since Dec. 2022. The central bank has been aggressive in its easing cycle, slashing rates by 185 basis points in just nine months.
The rate reduction was no surprise and is being described as the "last easy cut". Inflation is running at a 2.4% clip, above the ECB's 2% target but low enough to deliver rate hikes in order to boost the flagging economy. What's next for the ECB is a tricky question, especially with economic and political developments moving at a dizzying pace.
First, the new Trump administration hasn't wasted any time in imposing (and in some cases, suspending) tariffs, which has chilled investor sentiment and sent equity markets tumbling. The US hasn't applied tariffs to the European Union although it has threatened to do so. The EU would surely retaliate and a trade war between the two giant economies will damage growth and raise inflation in the eurozone.
Second, Trump is showing growing impatience with Ukraine and has suspended military aid. Germany has responded by easing its fiscal spending rules and has proposed a massive spending scheme for defense and infrastructure. This has sent German bond yields and the euro soaring.
ECB President Lagarde said after the ECB meeting that the situation was changing "dramatically" by the day and the ECB would need to be "extremely vigilant" and "agile". She reiterated that future rate decisions would be based on the data.
The US wraps up the week with the February employment report. Nonfarm payrolls sank to 143 thousand in January from 256 thousand a month earlier. The market estimate for February stands at 160 thousand. A surprise in either direction from nonfarm payrolls would likely have a significant impact on the direction of the US dollar.
EUR/USD has pushed above resistance at 1.0801 and 1.0837 and is putting pressure on resistance at 1.0889. Above, there is resistance at 1.0925
1.0749 and 1.0713 are the next support lines

Can Brazil’s Bonds Defy Global Chaos?In an era of escalating trade tensions and economic uncertainty, Brazil’s financial markets offer a compelling enigma for the astute investor. As of March 3, 2025, with the USD/BRL exchange rate at 1 USD = 5.87 BRL, the Brazilian real has shown resilience, appreciating from 6.2 to 5.8 this year. This strength, intriguingly tied to a bond market boasting 10-year yields near 15%, prompts a deeper question: could Brazil emerge as an unexpected sanctuary amid global turmoil? This exploration unveils a landscape where high yields and domestic focus challenge conventional investment wisdom.
Brazil’s bond market operates as an idiosyncratic force with yields dwarfing those of peers like Chile (5.94%) and Mexico (9.49%). Driven by local dynamics—fiscal policy, inflation, and a central bank unbound by global rate cycles—it has seen yields ease from 16% to 14.6% year-to-date, signaling stabilization. This shift correlates with the real’s rise, suggesting a potent inverse relationship: as yields moderate, confidence grows, bolstering the currency. For the inquisitive mind, this interplay invites a reevaluation of risk and reward in a world where traditional havens falter.
Yet, the global stage adds layers of complexity. U.S.-China trade tensions, while not directly targeting Brazil, ripple through its economy—offering trade diversion benefits like increased soybean exports to China, yet threatening slowdowns that could dim growth. With China as its top trade partner and the U.S. second, Brazil straddles opportunity and vulnerability. Investors must ponder: can its bond market’s allure withstand these crosswinds, or will global forces unravel its promise? The answer lies in decoding this delicate balance, a challenge that inspires curiosity and strategic daring.

USD lower, yields whacked on renewed Fed-cut betsEven as recently as two weeks ago, the thought of fed cuts were in the distant past. Yet a slew of weak data from the US since Friday including two consumer sentiment reports and a surprise PMI miss has seen markets reconsider a 25bp Fed cut in June. Today I cover bond yields, the US dollar index and futures exposure to update my dollar outlook.
Matt Simpson, Market Analyst at City Index and Forex.com

Critical 4.50% level being tested ahead of Trump speech and FOMCThe US10-year yield closed the week marginally higher at 4.48% after a busy week of events which saw the DXY stumble by 1.2% despite US CPI rising for the 4th consecutive month coupled with a rather hawkish yet upbeat testimony before congress from Fed chair Powell, which in my opinion was all dollar positive. US CPI for the month of January came in hotter than expected at 3.0% yoy, up from 2.9% in December. Additionally, on top of Powell’s comments regarding the strength of the US economy, the ISM Manufacturing PMI completely shattered expectations after coming in stronger than expected at 50.9 for the month of January.
The US10-year yield is currently testing the 50-day MA level of 4.52% as well as the blue support range between 4.45% and 4.50%. A break below 4.40% will however force me to invalidate my series of ideas on the US10-year yield calling for a move higher towards 5.00%. A break below 4.40% will allow bond bulls to pull the yield lower onto the 61.8% Fibo retracement at 4.30% and the 200-day MA at 3.69%.

US10Y: Buy signal on the 1D MA50.The U.S. Government Bonds 10 YR Yield is neutral on its 1D technical outlook (RSI = 54.381, MACD = 0.046, ADX = 33.861) as it is on a bearish wave insde the long term Channel Up pattern. The last HL bottom was priced on the 1D MA50. That is the most efficient buy entry to target the 4.0 Fibonacci extension (TP 5.100).
## If you like our free content follow our profile to get more daily ideas. ##
## Comments and likes are greatly appreciated. ##

Global Bonds New LowThe UK bonds have broken below the recent decades-low in the past weeks.
What has caused this turmoil? We will drill down into the specific dates that triggered this meltdown.
10-Year Yield Futures
Ticker: 10Y
Minimum fluctuation:
0.001 Index points (1/10th basis point per annum) = $1.00
Disclaimer:
• What presented here is not a recommendation, please consult your licensed broker.
• Our mission is to create lateral thinking skills for every investor and trader, knowing when to take a calculated risk with market uncertainty and a bolder risk when opportunity arises.
CME Real-time Market Data help identify trading set-ups in real-time and express my market views. If you have futures in your trading portfolio, you can check out on CME Group data plans available that suit your trading needs www.tradingview.com

US 10yr Yields Eyeing 5%?Chart Analysis:
The 10-Year US Treasury Yield continues to climb within a well-defined ascending channel, highlighting robust bullish momentum in recent months.
1️⃣ Ascending Channel:
Yields are trading near the upper boundary of the ascending channel (green-shaded area), reflecting sustained upward pressure.
Traders should monitor reactions at this boundary for potential breakout attempts or a pullback toward the channel’s midline.
2️⃣ Key Resistance Levels:
4.80%: Immediate resistance level, capping recent gains.
5.02%: A critical horizontal resistance zone, representing a multi-year high and potential target on continued strength.
3️⃣ Moving Averages:
50-day SMA (blue): Trending upward at 4.33%, providing dynamic support.
200-day SMA (red): Rising at 4.24%, reinforcing the broader bullish trend.
4️⃣ Momentum Indicators:
RSI: At 75.68, signaling overbought conditions, which may precede a consolidation or corrective pullback.
MACD: Bullish momentum remains strong, with the MACD line above the signal line and in positive territory.
What to Watch:
Sustained breaks above 4.80% could pave the way for a test of 5.02%, with potential for further upside if this resistance fails.
Any pullback may find support near the 50-day SMA or the ascending channel’s lower boundary.
RSI overbought conditions suggest vigilance for potential divergences or reversal signals.
The 10-Year Yield’s bullish structure remains intact, supported by rising moving averages and upward momentum. However, caution is warranted as yields approach critical resistance levels.
-MW

Nightly $SPX / $SPY Predictions for 1.13.2024🔮
📅 Tue Jan 14
⏰ 8:30am
📊 Core PPI m/m: 0.2% (prev: 0.2%)
📊 PPI m/m: 0.4% (prev: 0.4%)
📅 Wed Jan 15
⏰ 8:30am
📊 Core CPI m/m: 0.2% (prev: 0.3%)
📊 CPI m/m: 0.3% (prev: 0.3%)
📊 CPI y/y: 2.9% (prev: 2.7%)
📊 Empire State Manufacturing Index: -0.3 (prev: 0.2%)
⏰ 10:30am
🛢️ Crude Oil Inventories: -1.0M
📅 Thu Jan 16
⏰ 8:30am
📊 Core Retail Sales m/m: 0.5% (prev: 0.2%)
📊 Retail Sales m/m: 0.6% (prev: 0.7%)
📊 Unemployment Claims: 210K (prev: 201K)
📊 Philly Fed Manufacturing Index: -7.0 (prev: -16.4)
📅 Fri Jan 17
⏰ 8:30am
📊 Building Permits: 1.46M (prev: 1.49M)
💡 Market Insights:
📈 GAP ABOVE HPZ:
On a gap up, we will hold and run higher.
📊 OPEN WITHIN EEZ:
The markets will get a few days of a bullish run.
📉 GAP BELOW HCZ:
Everyone will eat up this drop; definitely look to position bullish here.
#trading #stock #stockmarket #today #daytrading #swingtrading #charting #investing

Market Update: UK 10Y Yields Back on Nov 4th, we highlighted a potential triangle pattern on UK 10Y yields. 📈 At the time, we noted that a weekly close above 4.75% would complete the pattern, offering a potential longer-term upside target of 6.6%.
Last week, we got a weekly close above 4.75%! While a monthly close would strengthen the case, for now, as long as yields stay above 4.50%, I'm leaning into this scenario.
Disclaimer:
The information posted on Trading View is for informative purposes and is not intended to constitute advice in any form, including but not limited to investment, accounting, tax, legal or regulatory advice. The information therefore has no regard to the specific investment objectives, financial situation or particular needs of any specific recipient. Opinions expressed are our current opinions as of the date appearing on Trading View only. All illustrations, forecasts or hypothetical data are for illustrative purposes only. The Society of Technical Analysts Ltd does not make representation that the information provided is appropriate for use in all jurisdictions or by all Investors or other potential Investors. Parties are therefore responsible for compliance with applicable local laws and regulations. The Society of Technical Analysts will not be held liable for any loss or damage resulting directly or indirectly from the use of any information on this site.

Look What 10 Year Yields Have Been Doing for The Last 10 YearsThis is a 10 year chart of the 20 Week SMA of the US 10 Year Treasury Bond Yield.
The simple moving average of the US10Y formed similar head and shoulder patterns, one inverse, before the last two large reversals.
