GDX higher , can VOX Royalty benefitIn 2021 Vox set out ambitious corporate targets for the year with an aim to grow and acquire additional NAV-accretive royalties.
By February Vox Royalty announced that it had agreed to acquire a Western Australian gold royalty portfolio from Gibb River Diamonds Ltd for A$325,000 in cash. With a total of 31 Australian royalties, Vox is now the second-largest publicly traded holder of royalty interests in Australia by royalty count, behind Franco Nevada Corporation.
Vox's gold royalty portfolio includes three advanced exploration gold royalties in Western Australia. The royalties include a 1% Net Smelter Return (NSR) royalty over the Bulgera Gold project operated by Norwest Mineral Ltd, a 1% NSR over the Comet Gold Project operated by Accelerate Resources Ltd, and a 1% NSR over the Mount Monger Gold Project operated by Accelerate and subject to a binding option agreement with Mt Monger Minerals Pty Ltd.
The Bulgera Gold deposit has an estimated resource of 93,880 gold ounces at 1.0 g/t.
With precious metals miners showing a positive reaction to the US10 year yields being capped under 1.7% currently, plus the weakening US dollar there is a real chance that producers ramp up production as prices of the yellow metal appreciate. $2k Gold seems to be the sweet spot for a lot of evaluations around the miners but there is sentiment building that the economy and monetary policy are going to be very supportive of traditional stores of wealth.
Yields

XAUUSD - Gold - GLD analysisXAUUSD is moving higher on the back of the weakening US dollar. However, into the end of trading Friday, the US10 year yields started to rise, as traders sold Bonds and bought equities.
The rising yields will keep the price of Gold capped, so during next week it is crucial that Bonds get bought, the US dollar gets continually sold, and that we get XAUUSD above 1850. Otherwise, the 3rd test of the descending trend line will be the first roadblock and Gold will come back into the $1700-$1800 trading range.
There is also a double bottom now at $1680-$1690 so a good target for anyone looking to take liquidity.
Targets to the upside include a measured move to $2250
US yields are key for the direction of gold as is the continuation of a weaker US dollar.

Gold Futures ready to popKeeping an eye on the relationship between the Gold Futures and the US 10 Year Yields.
Currently, the yields are coming off their highs, but the Gold hasn't reacted yet. If we get a breakdown in the US dollar, that will be the catalyst I am sure and currently, the US dollar index is finding resistance from old support.
Jobs data was good today, but there is a chance that NFP doesn't meet expectations as there are some lofty numbers being pushed around.

AUTO - TVL $1,835,701,489TVL in autofarm network is $1,835,697,008, but the AUTO coin price is very undervalued. Buy and hodl. AUTO is the next YFI but with better potential.

Are bonds ready for a bounce?Bond have fallen a lot and quite fast. The sentiment is really stretched and most expect yields to rise more (bonds to fall lower). In my opinion there is quite a decent chance the bond bull market is over given that we had a massive blow off top in March 2020, but this doesn't mean that I don't see a potential bounce here or even bottom. Bonds hit key support, swept the lows before the big move up and are no showing signs of life.
When I see so much debt, when I see slow growth and all the bad things going on around us... I don't think we'll get huge inflation any time soon. To me this is cyclical inflation after a supply shock rather than anything else. Many other yields are decreasing and spreads are the tightest they've been in years, so why would bonds go much lower? The Fed has failed to meet its inflation target for years, but they are going to make it now? We are also post the SLR cliff that could had been the 'sell the rumour buy the news event'

Inflation looks hot! Get ready to short tech if bonds break downWatch for bond breakdown as a Nasdaq sell signal
Early this year, the Nasdaq had its weakest run in a long time as interest rates rose (and prices fell) on the 10-year US bond. (Note that bond rates and bond prices move in opposite directions.) Both tech and 10-year bonds have rallied a bit since March, but amid heightened inflation expectations this week, I've been watching like a hawk for interest rates to begin rising (and bonds to begin falling) once again. I'd expect to see tech begin another large correction should bonds fall through their uptrend support line, which they're testing right now:
Signs that inflation is about to get hot:
1) Bloomberg and Arbor Data Science report more than 50% odds that headline CPI exceeds +2.5% year-over-year. That's the highest those odds have been in a long time.
2) Commodities like lumber and corn and copper continue to roar. Save your unpopped popcorn kernels, because corn futures are starting to look like a Tesla or Bitcoin chart:
3) According to Bank of America, "The number of mentions of ‘inflation’ during earnings calls also rose sharply, more than tripling YoY per company so far, the biggest jump in our history since 2004." According to CBS News, Procter & Gamble says it will raise prices in September. Other companies discussing price hikes include Kimberly Clark, Owens Corning, Mohawk Industries, Shake Shack, and McKesson. It's hard to deny that inflation is coming when companies are explicitly telling us that they will raise prices.
Signs that rate hikes are coming as well:
1) Rates are rising all over the world, not only in developing nations like Turkey, but also in developed nations like Russia. Rising rates signal that inflation is expected, and rising rates abroad put some competitive pressure on US rates to rise as well.
2) U.S. economists think the Fed will start tapering monthly bond purchases later this year, earlier than they previously thought. In other words, to control inflation, the Fed may end its policy of "soft yield curve control."
Financial conditions drive markets
We've just lived through an unprecedented bull market due to never-before-seen loose financial conditions. However, the bonanza may soon be over if inflation and interest rates heat up. Tightening financial conditions could lead to not just a sharp Nasdaq correction, but perhaps even a prolonged bear market if they last a few years.
With the Nasdaq poised near an all-time high and bonds right on the verge of breaking down, having slightly violated their support line today, I think at minimum I'll hedge with a Nasdaq put. Note the double top that may be forming in Nasdaq here.
Disclaimer: not financial advice.

10 Yr Yields starting to turn around as RSI turns over !!10 Yr yields continue rolling over after a failed attempt to turn green. Expect commodities to run a bit more as Dollar index and yields continue rolling over.
---
Possible dead cat bounce occuring with DXY and yields.

Goldman Sachs tactically retreats from crowded tradeAs of Jan '21, the US Dollar 💵 had one of the most crowded trades in the world. Since then, higher US YIELDS have forced banks and hedge funds to unwind more than $25 billion in the short trade.
However, the DXY is expected to go lower in the following 2021 quarters, economic recovery and sped-up vaccination efforts still threatens further gains for the dollar hurting gains made be the equity & Commodities markets.

USDCAD bulls took out last week high buy dips?Hello,
last week high been taken out, looking to buy pullback
Yields on the US "tens" above 1.75
... and the dollar is bid towards end of the quarter
Buying on dips towards 1.2605 / 2580
Stop below 1.2565
First target 1.2735 / 45
Good luck

Goldaholics Anonymous Pour yourself a glass of Goldschläger and let's review the 12 steps before diving into this.
1. We admitted that we were powerless over the Fed -- that our balance sheet had become unmanageable.
2. Came to believe that a Power greater than our central bank could restore us to solvency.
3. Made a decision to turn our fiat over to the care of sound money, as we understood it.
4. Made a searching and fearless inventory of our finances.
5. Admitted to Peter Schiff, Lyn Alden, and Pomp the exact nature of our wrongs.
6. Were entirely ready to have big, fat Gains.
7. Humbly asked to avoid getting short squeezed.
8. Made a list of all the naysayers about to be harmed.
9. Sent direct messages to them to gloat in victory.
10. Continued to count our gains and polish our bullion.
11. Sought through fundamental and technical analysis to improve our entries and exits.
12. Having had a financial awakening as the result of these steps, we tried to carry this message to other goldaholics, and practice these principles in all of our trades.
Macro Fibonacci
Below we can see the magic of Fibonacci extensions, measuring the last macro bull run to the 2016 low.
Zooming in a bit, it is clear that these levels attract attention. Each one of these fibs acts as a step in the staircase. All we need to do is look at volume and price action to validate each level. The smart money had their sell orders at the 0.618 Fibonacci extension. The 0.5 could not hold which indicates that the next level down will be tested. Watch for heavy volume to come in there near the 0.382 level.
In the U.S. stock market and many other developed financial markets, about 70-80 percent of overall trading volume is generated through algorithmic trading.
Historical Price Action
Looking back to the last bull run there are a few simple patterns to watch for...
1. Weekly MACD flailing around above the zero level.
2. Mark the down trends and wait for the break.
3. Price action is above the 20 Week EMA.
Trading Setup
Using historical price action the trading setup becomes clear...
1. Weekly MACD is flailing above the zero level.
2. The down trend line is clear. Wait for the break.
3. Wait for 20 Week EMA support.
Now, the targets are the Fibonacci levels above, and the ghost bars look reasonable, however, it would be wise to take a look at what exactly is driving Gold on this path.
The U.S. Dollar
The Dollar index inversely pressures Gold prices so this is worth noting.
1. Momentum is shifting bullish as a bullish MACD divergence reveals itself on the daily chart.
2. This recent move was the 3rd wave down which often precedes a reversal.
3. The index is at the bottom of this future channel.
As this index recovers back towards the 200 Week EMA, it will surely scare the metals market. However, the macro downtrend is only on it's first wave down. From a technical standpoint, the second wave is often the deepest as panic sets in from the failed recovery.
Treasury Yields
Yields recently had a similar bullish MACD divergence with a very weak recovery that followed. The trend is still clear and it's highly likely to roll over as it timidly approaches the trendline in the coming months. Gold has been riding along side Bonds so this should continue to drive up prices. Depending on the severity of falling yields, it could trigger temporary crashes in the metals. But longer term, buying the dips is the way to go.
Trading is risky. Don't do it.
Long
Bullion: Gold, Silver, Platinum
Equities: GDX, PHYS, CEF, SLV, RIO, SPPP
Futures: (Not yet)

BOND YIELDS bearishBOND YIELDS bearish
Good luck for your trades.
This post does not provide financial advice. It is for educational purposes only! You can use the information from the post to make your own trading plan for the market.
But you must do your own research and use it as the priority. Trading is risky, and it is not suitable for everyone. Only you can be responsible for your trading.


US10Y LONG20 years of this downtrend that may be heading for a breakout in the next couple months. I will be looking for aprox : 2.2 for a PT within the next two months. This value has been approximated using the 120 EMA in magenta.

Rough estimates for 20% correction on the IXICDepending on where you call the start of the correction, the final 20% drop level is different.
From Peak (in blue) = 28,500
From recent low (in yellow)= 26,500
From recent floor (in red) = 25,000
When the TVC:US10Y hits 2%, the Nasdaq could see a 20% drop as they are the growthiest stocks with the most minimal dividends. DJI is the safest from the rise in rates with an average dividend yield of roughly 2.36%.

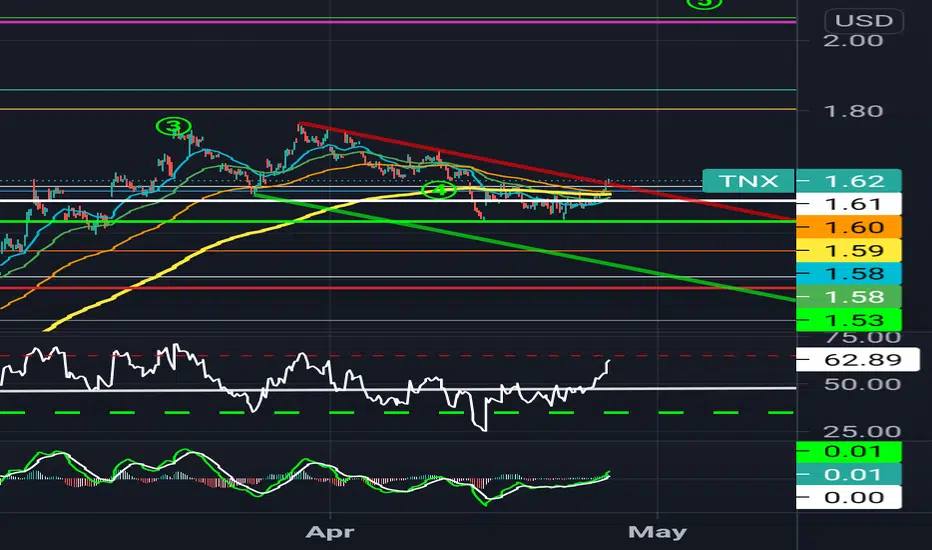
$TNX Direction & Dot-Plot summaryTechnical Analysis
Technically speaking, 1.6% had been a very important level, as we tested 6 times, before continuing higher.
Now the 10sma which has been working very well year-to-date, is lining up with the 1.6% level.
I expect some selling to reach the 10sma at 1.6%, for a bounce to 2%.
Dot Plot Summary
7/18 FOMC officials are predicting higher short-term interest rates by the end of 2023, as compared to 5/17 at the December meeting (i.e., a growing percentage who see an earlier start for rate hikes). Notably, four officials now expect a rate hike at some point next year.

2% yield is coming--soonHello everyone,
I drew this pattern a few days ago when analyzing the SP500 behavior in recent weeks. I believe the market boogeyman is not gone and that today was just a taste of what he has in store. 2% yield will not be in July. It will be here in April or June... and as early as March 29th.
The yields are behaving extremely bullish lately. The blue lines represent an ascending channel that is consolidating at higher lows. In the past few days you can see that the pattern is returning to the center of this channel less and less. It's breaking out of the channel to former a sharper one. So we've got increasing curvature.
I believe the yields have a strong possibility of going parabolic unless the fed takes control. Given JPOWs speech, he is going to be reactionary and not prevent it. So it's definitely in the realm of possible and trending towards it. I believe this could have severe implications for the equities market. I've drawn a purple 2% yield line which is being eyed by the market as a whole as a possible 'catalyst' for a 20% correction. At 2%, the yield allows the bonds to break even by surpassing what JPOW says is inflation.
The bond market is not believing JPOW and the Fed. They seem to believe inflation is over 3% and as high as 4%. They also seem to believe that it is not transitory. The yield is also becoming suspicious. I believe there are a number of short sellers hitting the US10Y in an effort to push the fed to raise rates. I have no proof. Only a gut feeling based on observed price action.
Be careful. A parabolic yield could induce a panic leading to a possible limit down on the NASDAQ/SP500. You're welcome to view my forecast I made on March 12th. We are seeing some deviation but the overall pattern remains.
If I am trading right now I would be in cash or in puts. Please trade carefully. The market may experience extreme volatility as the TINA effect weakens. (There Is No Alternative -- meaning stocks have the best return possible and there is no competition)
Disclaimer: I am holding puts and have been for a few days. I am not a financial expert or advisor. Trade at your own risk.

US10Y .... some crayonnageThis is getting quite interesting... the poles are getting more and more vertical while the consolidation are getting shorter and shorter...

End of volatility? Yields continue to rise. Spy could crack.Hello. Despite this weeks amazing rally, I believe it's too much too soon. The yields are continuing to rise and could be as high as 1.7% by late Monday/Tuesday. How could it affect the market? Some economists are predicting that a 2% yield on the 10 Year will result in a 20% correction in stocks. This is in line with the bearish megaphone that has formed. There's a possibility that we are approaching a peak. The rejection could take us quite close to the economists warning of -20%. 350 could happen which is around a 18% correction.
What do you think? Leave your comment below. I believe we have 1 more dip before truly breaking out of this. For now, I remain short and will load more puts should we try to push past 395 to reach 400. At 400, I will go all in on puts.
Currently holding puts for 390 strike by friday.
A circulating idea has been that we will have >2% yield by June.
Trade at your own risk.

7 MOST IMPORTANT CHARTS TO WATCH RIGHT NOW1. VIX is filling the gap from when the Feb-Mar crash begun. Volatility is getting supressed when things actually look very fragile with Central Banks having nothing under control. A VIX spike (big move down for stocks) wouldn't be a surprise here for reasons I'll explain soon.
2. DXY looking strong here. The 50 DMA has turned up and dollar strength could be a problem here. Watching other charts tells me things are OK, so the weakness comes from specific currencies. Some currencies are doing very well while others very poorly and there is no concrete way to go about it.
3. CNH/CNY however are very clear as to what is going on. They seem to be in agreement with the DXY. The relentless USD downtrend has been broken and the USD is showing signs of life. Despite the QE, despite the massive stimulus... the USD hasn't gone down. That's not a great sign. Sure most currencies are getting devalued, but if the USD is so strong and could begin an uptrend we have a problem...
4. Essentially most of that is attributed to US long term rates going up faster than anywhere else. This could be happening for many reasons, right or wrong. Inflation might be here, inflation might be coming... but it depends on which country you are looking at and in what form you are seeing it. Is it because of supply shocks (i.e low Oil and Copper production), currency debasement, loss of faith in the currency or trade wars etc? It could be many combined, but when we see bonds go down it could the fact that we have a lot of supply coming in and not enough demand. Maybe we had such a big bull market that people are taking profit. However the impact this has on the market is on many different levels and it comes down to how the market is structured, stock valuation models, different investment strategies and so on. So the more yields go up (bonds down), the bigger the problem becomes if it is relentless.
5. Gold has been going down because real yields have been going up and people have been taking more risk. Why hold gold and not other more useful commodities or riskier assets in general? Gold going up isn't a good thing. It means something is not going well. Over the last few days Gold didn't go down along with bonds, which is worrying. It is stuck between and uptrend and a downtrend, however it is clear it is currently in a downtrend as it is below all key MAs (50-200-300 DMAs).
6. Oil has had a massive rally and I can't tell whether it is over for now but it could be. Very high oil prices in the current environment wouldn't be ideal, but hopefully because more oil is being produced, not because demand is down. Low oil demand means low growth and bad things in general going on. High oil demand means growth and go things going on. Oil got above the 2019 highs, swept them, retested them and went down quite a bit. It also crossed above the big diagonal downtrend from the 2008 high all the way down here and then came back down. If it closes like this and goes lower, I can't rule out 52$ or even 42$, but if it starts going above 68 it could quickly accelerate higher.
7. RUA is the index that has the top 3000 US stocks, spot. It is just an index and doesn't track futures but spot, so it isn't open 24/5. Stocks are still in an uptrend, which Japanese and European stocks showing quite a bit of strength. We've seen quite a few US stocks do well, but if the top US stocks struggle because of higher rates... there could be a big problem. If bonds start selling off hard, the borrowing costs for many companies will skyrocket. That is clearly a massive issue right now. So is a 20% like the one we had in 2018 possible? Yes it is. Do I think stocks could still go parabolic? Of course, but it might take some extra time to get there. We need bigger actions from central banks and eventually bonds slowing down and go up slowly. For now we could get another 5-10% correction, test the trendline and go higher. Until I see the market close below I think up is more likely, although I am more cautious.

WATCH OUT with this PUMP!WATCH OUT GUYS 👉 ALL THIS COULD REVERSE during the Press-Conference, which is why I decided to take a little bit of profit here and rather wait❗️
"The Federal Reserve kept interest rates and its monthly pace of bond buying unchanged Wednesday, even as it acknowledged an improved economic backdrop as vaccine roll outs gather pace."
It seems like the market has priced in a potential rate-hike (pretty unlikely to be honest, but the reaction shows it), which is why equities and majors vs USD are pumping.
As you can see, the FED still decided to keep its Bond Purchasing Programm unchanged 👉 They probably don`t do anything to cap yields, which WILL likely cause more inflation-worries and so a potential reversal of the current moves due to rising yields.
Let`s wait for Jerome Powell and see what he has to tell us!🙏
If he meontions yield-capping- we might see a continuation!

The sharp rise in yields may not end the the tech rallyYes after the pump in yields in the last days, the NASDAQ:QQQ
to NASDAQ:TLT spread did a nice correction.
This correction however, by no means ends the bullish move, nor does it even introduce a bear market.
Actually the chart now looks even more bullish and I might have sold a lot of positions too early on Friday.... :/

US30Y Time for bond yields to reverseThis is the U.S. Government Bond 30Y Yield from 1988 until today. I chose this hyper long-term chart on the 1M (monthly) time-frame as with bonds being the talk of the month as for reasons that may move stocks, Gold etc lower, I wanted to get a good understanding of what the real long-term picture is.
This illustrates a clear and standard Channel Down. I have applied the Fibonacci levels on it. As you see the price is now testing the 0.618 retracement level, which is exactly on the 1M MA50 (blue trend-line). The chart clearly shows that the MA50 and the MA100 (green trend-line have been acting as a Sell Zone since at least 1995 (where we can measure). We can see that only once over these decades did the price (marginally) break the 0.786 Fib (October/ November 2018). On all rejections within the MA50/100 Sell Zone, the price always pulled back to at least the 0.236 Fibonacci level.
That means that the upside is limited on the US30Y and we will most likely start seeing a bearish reversal soon.
** Please support this idea with your likes and comments, it is the best way to keep it relevant and support me. **
--------------------------------------------------------------------------------------------------------
!! Donations via TradingView coins also help me a great deal at posting more free trading content and signals here !!
🎉 👍 Shout-out to TradingShot's 💰 top TradingView Coin donor 💰 this week ==> xBTala
--------------------------------------------------------------------------------------------------------
