SPX500 COULD get PROBLEMS!Hey tradomaniacs,
YIELDS are still in focus and could cause problems for the stock-markets.
Why is that so important?
First of all you have to know that there is a difference between capital market rates and the Federal Funds Rate.
The Federal Funds Rate is an control mechanism to keep inflation, demand, supply and more economy related points balanced.
Capital markets refer to the places where savings and investments are moved between suppliers of capital and those who are in need of capital.
The rate of the capital market depends on the current risk which is increasing with the inflation.
Example:
Let`s say you borrow money to a customer with a duration of 1 year.
In this time-period you expect inflation to increase, means the money that you will earn with this deal will have less value than now.
As a compensation you claim a higher interest-rate in order to compensate the depreciation 👉 This is basically why YIELDS are currently rising!
Additionally you claim a bonus for special risk as higher inflation could cause a payment default of your customer.
This shows that Central Banks have way less impact on capital market rates, hence it is way harder to predict when YIELDS stop rising.
Why could that be a problem for stocks? Inflation is good isn`t it?
Simply because rising interes-rates mean less demand in credits due to higher expenses 👉 Less investment 👉 Less consume
When you look at this context you could assume that we kinda stuck in a loop.
1️⃣ FED prints money and causes inflation 👉 Bad for dollar and good for stocks
2️⃣ Capital market rates rise due to inflation 👉 Good for dollar and bad for stocks
...and so on...
I hope this helps you to understand why the current market is so choppy.
LEAVE A LIKE AND A COMMENT - I appreciate every support! =)
Peace and good trades
Irasor
Wanna see more? Don`t forget to follow me
Yields

USDJPY correlation with interest rates USDJPY has been bullish for the past four weeks. Of interest is that the spot currency is moving in tandem with treasury yields.
What's next for the USDJPY?
It has approached a strong level of resistance and a 50-week moving average
I'll be monitoring the currency to determine whether it will break the 50-week moving average as rates keep rising.

Should you be concerned treasury yields are rising?The lowest-rated debt keeps outperforming safer securities, with investors apparently more concerned about Treasury yields moving higher than credit risk. Investors are now demanding the least extra yield to own junk bonds over investment-grade notes since 2014.
Rising treasury yields implies one of two scenarios is happening or about to happen.
1. Global economic recovery is happening as a result of increasing vaccination and economic activity as countries open up. Inflation is actually rising to Central Banks' targets
2. Markets are about to crash with US FED & ECB struggling to push inflation higher.
What are the financial markets telling you? DXY? S&P500? DAX 30? Commodities?

USDCAD will rising us yields help with 1,30 rally?Hello,
US yields have been a hot topic since the beginning of the week.
Will the Fed allow it to continue or will we see the CAP?
In the first movement, "commodity currencies" may suffer, the end of the week may be interesting.
Buying between 1.2640 / 20
Stop below 1.2590
First target 1.2890 / 1.2900
Good luck

WHY IS FOREX not moving? Here is the answer!Hey tradomaniacs,
As you may have noticed the market is not moving as it should looking at fundamentals and news which is why I`m still staying aside.
A positive newsflow of economic data and very good earning reports plus a rising stockmarket are not really driving currencies as they should due to the fact possible stimulus could continue to boost US-YIELDS, which is currently in favour of the US-Dollar .
In this case we got two intermarket-correlations which are contrary making it harder for forex-pairs to move smooth and clear (especially risk-on-pairs such as AUD/USD and NZD/USD ).
Another example is USD/CAD as the market does not really know where to go as CRUDE OIL currently rises with the US-Dollar .
DXY (US-DOLLAR-INDEX) is by the way creating its first divergences looking at Momentum and indicators such as MAC-D and RSI and I`m waiting for the market either to break through the key-resistance or to create a double-top.
Bond prices and yield are by the way inversely related.
So what shall we look at?
As long as YIELDS continue to be strong with risk-on in the stockmarket we might see currencies stuck in major trend-areas.
This means we either wanna see risk-off in stocks for a bullish USD or falling YIELDS with rsik-on in the stockmarket for a bearish USD!
LEAVE A LIKE AND A COMMENT - I appreciate every support! =)
Peace and good trades
Irasor
Wanna see more? Don`t forget to follow me!
#Patience

AUDUSD - IS IT TIME TO SELL...?! AUDUSD - Technical View:
We've had a bit of a risk on move start this morning but equities and yields are both at key areas. In technical aspect we are a key resistance area in Aussie where I will be looking to add a short position on and scale in as time goes by.
Technical:
Pattern: Double Top for wedge forming.
Support: 0.76425, 0.76280, 0.758050 (200EMA)
Resistance: 0.77275, 0.77435, 0.77830 (50EMA)
Fibonacci Retracement: 0.618 - 1.618 or 0.382 - 1.618
Ways to trade Aussie?
- You could enter short position at this current moment of time and scale in towards key areas.
- Add an order towards the key areas once breached
- Double top, we at resistance - putting your stop as the correct area that goes with your plan will be something to think about
- Go with what's in your trade plan not forgetting where you'd like to enter making it a great R/R (Risk/Reward) Trade.
Fundamentals:
- President-Elect Biden Speaks
- Treasury nominee Janet Yellen to say U.S. does not seek weaker dollar: WSJ
Key tip: Add your own creativeness towards your trading plan towards this idea - the idea I generate for you is only here to give you extra confluence towards your trading.
Overall, it's at key area AUD for perhaps an intra-day/swing trade if planned correctly & depending on fundamental aspects as well.
All the best,
Trade Journal
(Just trade ideas, not recommendation)

10Y Yield Looking Strong After a Weak 20Y AuctionIf I were a betting man, I'd say the 10Y yield looks poised to test 1.20% as early as this week. A weak 20Y auction which saw $24 Billion in demand at a significantly higher yield than December, could be indicating weakness in the bond market.

(DXY) What Really Is Driving Gold (Yields)There is much speculation across the investor universe about what influences Gold prices and vice versa. Today I will be focusing on the false theory that Gold prices lead treasury yields and that by extension, Gold signals market crashes.
The Financial Solar System
Taking a look at the chart it is clear that sometimes Gold prices parallel and slightly lead treasury yields. However, if we overlay the Dollar index it is astronomically clear that the only times that Gold does this is when the Dollar's gravitational pull temporarily alters Gold's trajectory. Gold prices at the root are inversely corelated with Treasury yields.
It is really that simple. The Treasury market is the Sun while Gold, the Dollar, and the Stock market are planets. As treasury yields ultimately dominate and inversely lead Gold prices, the Dollar acts as a secondary force.
Yields are the only pre-signal for Market crashes and it looks to me like another leg down is imminent. However, it also looks like the dollar is setting up for a relief rally which means Gold would plummet along side stocks before the Sun sling shots it to new highs.


USDJPY Longs in play with US yields supportHi,
a firm return from below 103.50 thanks to rising yiekds is not complete in our opinion
The combination of 'fast money' and more short squeeze can push price higher towards 107+
Risk factor: yields / market sentiment
Looking to buy on dips towards 105 and 104.4
Stop below 103.60
Target 107.20 / 30
OR
Buy on the break of 105.60 (on the retest)
Stop under 105.20
Target 107.20 / 30
Good Luck

Real Yields vs. GoldThe correlation between real yields and gold price is well known, has strengthened since 2018 and in many ways works a lot better than e.g. the one with the M2 Money Stock. The (speculative) overshoot in gold in August 2020, very much like the one in August 2011 has corrected.
Assuming the correlation remains strong, further price action in gold will depend on where real yields go. After the GFC real yields reached -1.67%. Considering the largest portion of bankruptcies of this recession is yet to come and seeing that real yields during the aftermath of the GFC occurred in Sep 2012, almost five years after it started, combined with record debts mandating low yields and low inflation expectations, I suspect in the coming years real yields will go lower and barring attractive investment opportunities gold still higher.
NB: In 2012 gold could not achieve another record high despite lower real yields. The high from 2011 remained the record high until this year.
Silver is included for comparison, it is not far off the mark.

EURUSD another upside break, buy dips with 1,21 as a targetHello,
the dollar is reaching new lows, yields are scouring the bottom (probably up to a point) and EURUSD at the highs ...
1.1904 previous "high swing" broken and now as the first demand level,
1.1840 untested level as second demand level
stop below 1.1825
First target 1.20
Second target 1.21
good luck

Metals sold off yesterday because of bond yieldsIn a recent post, I showed the strong correlation between inverted real bond yields and gold and silver:
The hot inflation data yesterday and today drove nominal bond yields sharply higher. Bond investors demand higher yields when inflation is hot, which is why nominal yields rose. The rise in nominal yields broke a trend line. Here is the trend line break on the nominal 10-year yield:
The trend line break suggests it might be a good time to be short on treasury bond funds like VGLT, since bond prices fall as nominal yields rise-- however, keep reading, because as I'll note later in the post, you've got to beware of Fed yield curve control.
The picture for real yields is a little more complicated. The real yields chart above only shows data up to August 10, because the chart lags a couple days. Real yield is calculated by subtracting 10-year breakeven inflation from 10-year nominal yield. FRED's 10-year breakeven inflation rate was priced at 1.63% as of last update yesterday:
However, the new CPI number implies an annualized inflation rate in the neighborhood of 6.0 - 7.5% this year. Obviously no one expects that to persist for 10 years, but the 10-year breakeven inflation rate is bound to keep creeping upward after this hot CPI read. The question is whether it will move upward faster than nominal bond yields. If so, then real yields will continue to fall. If not, then real yields will start to rise.
It's possible, as a recent Seeking Alpha article argued, that the Fed is already exercising yield curve control to keep nominal 10-year yields in the range of 0.6-0.7%. If so, then we should expect nominal yields to stabilize here rather than to keep moving upward. If nominal yields do stabilize, then the rising 10-year breakeven inflation rate should continue to drive real yields lower and gold and silver higher.
seekingalpha.com
However, the trend line break in nominal yields suggests that if the Fed doesn't exert yield curve control, then we might see rising nominal yields outpace 10-year breakeven inflation for a little while, driving gold and silver lower. The next three or four days of real yields data should provide an important signal for where real yields and metals go from here. My best guess is that metals will bounce for at least the next day or two, and then we'll see from there.

Yield divergence with the NZDResistance at a weekly down trendline, slight divergence with the bond yields and the Kiwi currency index. Talk of wanting RBNZ wanting a lower NZD, the yields are dropping, which the NZD in theory should follow.
Black - NZDJPY
Blue - NZD Currency index
Red - 2 year bind yield
Light Yellow- 10 year bond yield

Wondering why GOLD drops? Here is WHY!Hey tradomaniacs,
lots of Robin-Hood-Traders are asking themselfs: Why is gold and silver dropping?
Well it can have a lot of reasons such as Profit-Saves due to the overbought situation, the fact that stock-market continues to climb and SPX500 is almost at its All-Time-High (portfolio turnover).
It can be the fact that DXY (US-DOLLAR-INDEX) is oversold and so likely to retrace.
There can be a lot of reasons but one very obvious correlation that makes sense: US BONDS YIELD went straight up after hitting an all-time-low.
Why is that? When there is still uncertainy and fear the stock-market all the institutional traders are looking for save havens.
Save havens are usually alternatives to stocks such as metals, currencies like YEN and CHF or BONDS as you get a safe and fix return for your investment.
But what if the interest rates are too low? You look for alternative assets which are not interest.
Gold has always been a save haven, which is the reason why the current rally makes no sense.
Why would CHF, YEN, metals such as Silver and Gold climb at the same time? Because the market is uncertain!
Gold currently has a negative correlation with US-BOND-YIELDS as it is a no interest asset and a good alternative for a low-interest-market.
Watch these YIELDS when you do your analiysis for gold. ;-)
LEAVE A LIKE AND A COMMENT - I appreciate every support! =)
Peace and good trades
Irasor
Wanna see more? Don`t forget to follow me.
Any questions? PM me. :-)

Greece 10-year bond nearing ALL-TIME lowsReally, really remarkable to see this.
Remember the Greek/eurozone debt crisis? That's what the big spike is. Now, here we are. Greek bonds are nearing their lowest levels ever.
The only explanation is that people are seeking the safest form of assets in government bonds and Central Banks are becoming more helpful managing debt and supporting their countries.
I share this as an observation that is shaping the world and the economy picture. It also is potentially showing the strength of the Eurozone and the way the countries are coming together. Pay attention to the EURUSD or European assets in these countries. If they are indeed balancing their budget, have their fiscal house in order, and the central banks are willing to support them, Europe could be ready for some more strength.

VIXBlue line is the 10 yr, they should start to diverge as yields rise and VIX falls. (in the perfect bull world)

GB10Y - counter-trend move under wayGB10Y seems to have finished minor wave 1 and should enter in a correction with a potential target at 0.52. If yield crosses down 0.07, this analysis should be reviewed. FOLLOW SKYLINEPRO TO GET UPDATES.
DE10Y - counter-trend move increasing ratesGerman 10-year yield is tracing wave C up that should complete intermediate wave 2. The most probable targets are -0.05 and 0.15. If yield crosses below -0.60 this analysis should be reviewed. FOLLOW SKYLINEPRO TO GET UPDATES.

FR US yields vs EURUSDInterest rates are crucial in the movement of currencies. The blue is EURUSD. Those things are not 100 percent correlated but it is something that needs to be paid attention to.
In this post I will demonstrate the relationship between French American bond yields (interest rates) differential and EURUSD.
We use 2 principal yields 2 yearly and 5 yearly composite differential.
As you see, once the yields differential hits the resistance or reversal level (here we use DeMark and Camarilla reversal levels) - there is a reaction in EURUSD. EURUSD keeps moving some 30 pips more (fakeout?) and then turns as well.
On weekly differential chart we see that the differential is at 0 level after a poor bullish breakout. There is also fractal pattern in play.
We also see DeMark monthly pivot squeeze on 60 min (DeMark squeeze predicts volatility and turns in the markets).
You may also use German yields instead of French ones - not much difference actually.
Both American and European yields are in their lowest levels. German ones dropped below 0.

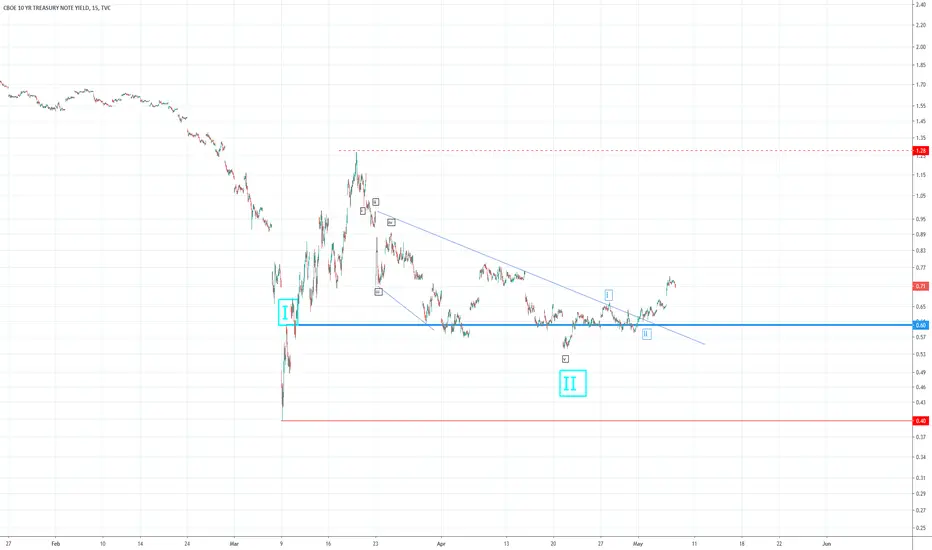
US 10 YR Bond Yield - Wave 3 Has CommencedLooks like the expanding ending diagonal in the Wave II correction ended around April 21st.
An expanding ending diagonal indicates strength in the move ahead.
I am expecting this to move up from here.
A break above 1.28 should confirm a bottom is in place.
Please LIKE and FOLLOW to get notification of updates and future posts.
Scary and Unthinkable: Negative Yields are ComingThe US 10 Year and really, yields around the world, have plummeted to levels no one thought was possible. However, the unthinkable has become thinkable. I believe the US 10 year is likely only a week or so from 0.500 and if the Fed cuts rates again this month (as is likely), we could see 0 by the end of the month.
The real question though is will the 10 Year stop at around -0.150 or will it continue to fall? Only time will tell, but the near-term target is 0.000. In reality, it is very possible we can overshoot the lower trend-line to a whopping -1.000 or lower if the global economy shows no signs of any sort of stabilization and the virus continues to drag on and worsen.
As we move into 2021, yields will likely stabilize and rise, however, this will not be a good thing. Contrary to other recessions and down-turns where the dollar actually rose, in this impending recession, the dollar (DXY) will fall (tank), Gold will go parabolic, and more worrisome, other commodities could eventually spike given the fall of the dollar. That means we could see a surge in inflation eventually, as fiat currencies lose their value as a result of negative rates.
We are certainly entering unprecedented territory and investors must hedge against this unprecedented time by investing in Gold. At this present time, the only equities to seek out are high quality dividend stocks with a history of multi-decade dividend hikes. My favourite in this environment are utility stocks, such as Fortis, which has incredibly high stability and a whopping 46+ year dividend hike increase.
This is not the time to be dip-searching because equities have still a long way to fall and still trade at 17-18x forward P/E representing still at-least a 10-15% overvalued market. At some point, the SPX will test the 2600s and we all better hope that level holds or we will see panic like we never thought would be possible again.
Under no circumstance can equities have a sustained rally (that doesn't fade) until the 10 year hits at-least the +1.000-1.250 level which could months or years away.
- zSplit
PS: Once the US 10 Year hits 0, there will likely be some sort of massive algorithmic sell-off waiting to pounce; investors should have SLs ready for this.

𝗕𝗼𝗻𝗱𝘀 𝗨𝗽𝗱𝗮𝘁𝗲: $TLT Daily. Move Hitting Target AreaOver 150 today! Coming into a major decade long TL near 152-153. Nice trade if took the setup
