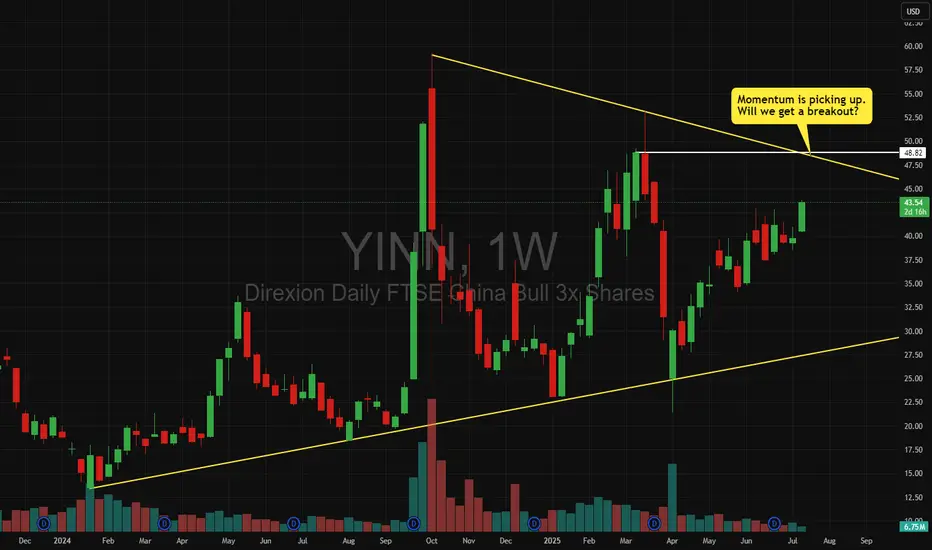
YINN - We could get a bullish breakout of the triangleMomentum seems to be picking up.
Will we a break out of the triangle?
Let's watch the $48 level.
YINN
$PDD Long to $106-$108I entered into a long on NASDAQ:PDD at $97.50 and am moving my stop loss up to $97.5 from $95. Either PDD breaks $100 and we reach downtrend resistance around $106-$108, or it gets rejected here and goes down further. I'm positioning myself in case this happens, potentially losing current profit but leaving the trade open for an additional 7-9%.

HSI - KWEB - FXI - YINN --- China UptrendChart is self explantory. Bottomline I think we came to the end of 4 year long bear market in China. If they don`t blow up the Taiwan issue, coast is clear.
Econ gathering on 14-16 July, CCP will explain it reforms. I don`t buy what they sell but they would most likely provde liquidity to the market pre and post this economic forum which they do every 5 years. Even for a small pop, this could be a nice play.
BABA - PDD - JD - Tencent...ideally I play with YINN but all the names will benefit eventually.

SIZZLING-YINN-HANDLE!!!! There's been a global paradigm shift As Biden's re-election prospects diminish and recent events are raising concerns. While US and Europe valuations are within fair value range based on forward P/E ratios the tremendous laggard China has turned its corner in cracking the chip after Pres Xi spent about $2T equivalent in US dollar that is a lot but at least he accomplished what he intended when he came in office and announced the "common prosperity initiative" to solve demographic generational chasm from the one child policy before and thee are not enough producers to support the rest and to solve this make home affordable again as children live with their parents until age 55 on average and this is not ideal for starting a family they need their own home. Well fold housing down 95% mission accomplished lol Tech Sector crackdown and sanctions on top of a strong US dollar also beat down China tech index clubbed like a baby seal down 75% . many have contemplated is China investable. We ladies and gentlemen. Bottom Line = YES! .........PLAY BALL!
Notice: Think for yourself before comparing your analysis. Past does not equal future, same goes with price discovery. Leverage ETF products have additional risks and design for short term trading and speculation and someone who has a system with automations and watching the Bloomberg. This is not intended to be a recommendation in absolute. If you do not fully understand please consult an advisor, make sure you have adequate cash reserve and can afford to lose as invest like this leverage 3x so that is a notional value of 300% of a potential 25%83=74% in one handle (move). Remember to cut your losses because it takes a 100% return to break even from a 50% loss. I would expect this trade to take 2 weeks to mature but could take a month and it may be down at first, but the paradigm has changed, and this is the trade for now.

YINN & YANG Market Cycles and Ratios YINN LONG nowThis weekly chart of the YANG /YINN ratio explains the rationale of the demonstration of the market cycle over the period of a few years as it relates to taking a swing trade in one or the
other and finding the likely pivot points based on resistance and support as static levels or
importance. Dynamic levels using an anchored VWAP and also a Bollinger Band are used to
support analysis and finding pivot points of importance. This is meant to be a methodology of
decreasing risk while optimizing reward. The same methodology could be deployed onto
a shorter time frame of 120 minute time frame to zigzag more often with greater precision
and potentially achieving greater profits over a given time interval. An optimal reversal on the high side is a confluence of the horizontal resistance /supply area with the upper Bollinger Band and the uppermost of the anchor VWAP bands.

YANG ( a 3X leveraged inverse China megacap ETF ) LONGYANG on a 240 minute chart had a reverse head and shoulders pattern last summer. Price rose
over the neckline in November and hit an increased trend angle at that time. With a set of
VWAP bands anchored to the neckline cross, TANG had pulled back twice to the mean VWAP
where it found support, the latter of which was this past week. While price is currently at
15.5, I could reasonably forecast another rise to the second upper VWAP bandline at 18.00 or
about 16% upside. Price rose more than 4% today and 20% YTD for January.
Fundamentally, China is in a recession. Additionally, the terror and tension in the Red Sea
has increased shipping costs and diminished shipping volumes through the Suez Canal a
a major gateway to the Eurozone markets or even Western Russia. The CCP has pleaded directly
to Iran about this as the whole situation is worsening the China economy ( among others)
The idea of China launching a gold standard currency seems to be out of the news at least for
now. What is still on the table is Chinese interests in Taiwanese reunification. Any military
action would basically flush Chinese stocks into nothingness because a trade war would ensue
if not WW III. This lingering in at background is a drag on the China stocks.
I see YANG as a safe bet now with an entry just above VWAP with a stop loss above it
and 18.00 for the target.

YANG China Leveraged Bearish LONGYANG benefits when the China factories slow down and the economy stagnates
which is the present situation. The weekly chart shows YANG at its highest before
and after covid in 2019-2020. The volume profile shows over the 3+ years most shares
have traded at the present price levels. Price is rising above the POC line of the
volume profile and approaching the long term mean VWAP. The RS indicator shows
sideways strength movement in the mid-ranges. The MACD is curling upward over
a low amplitude histogram. The Asexome Oscillator is sideways. Overall, I will place a
long trade here and then supplement it with an add when the trend direction is stronger
and the Average Directional Index gains amplitude.

NIO finishing a Fib Retracement Ready to Continue LONGNIO on the 4H chart was on an uptrend into a double top in late July and Early Augus. This
was confluent with the second upper deviation line above the mean anchored VWAP line
which is thick black. Now on the retracement price has hit the mid-Fibonacci levels of
0.38-0.5-0.62. The MACD is sowing an early buy signal with a line cross under the histogram.
I see this as a long trade on continuation with some early bullish divergence with a
the potential upside of 20% back to the VWAP lines whose resistance forced the double top.
I will put this on my China watchlist watching for the pivot low from which to enter.

Is JD a Chinese economy equity setting up a reversal?JD on the long term weekly chart appears to be in a descending wedge pattern which
would generate a bias for a breakout upside. Price is now supported by the one standard
deviation line below the VWAP bands anchored to 2019. The analysis of the ultralong term
volume profile is that the Point of Control is just below price and that the vast majority of
trading volume has been above the current price. I can readily presume that JD is at or
near a bottom and most certainly the 1, 2, and 3 year lows. Analysis on higher time frames
such as the weekly are more likely to be accurate with good signals. On the MACD signals
have crossed in mid-May and now ascending in parallel toward the zero line while price
is bouncing around at what I will call the bottom. Said another way, the MACD is showing
bullish divergence. The upside here over a long term could be as much as 250% and much
much more with a long expiration options contract. I will open a long trade here in
a small position with a stop loss below the POC line and DTA into it over time whenever there
is a pivot low on the weekly chart. I am confident that the Cinese economy with supposedly
zero inflation will be an excellent backdrop for Chinese stocks to run higher in due time.

How To Make Money playing lagger Bull Stocks- XBI IWM ARKK FXI these sectors may play lagger bull catch up soon if market continues to run
- PYPL BABA and other growth stock names may as well.

YINN - a leveraged bullish ETF for Chinese stocks.YINN is a 3X leveraged bullish ETF of Chinese stocks. As can be seen on this one hour chart,
YINN has jumped nearly 30% since the beginning of the moth. On the chart is a moving average
ratio indicator ( with settings SMA7 / SMA28 ratio ). When the ratio crosses the zero line, the
shorter average is rising faster than the longer average demonstrating bullish momentum. Here
I used it as an entry signal. ( the exit signal would be the ratio dropping below the zero
horizontal line which has not yet occurred) For confirmation and further entry justification,
the volatility indicator shows spikes above the running average volatility in order to be
that there is enough volume and price action to get into a good trade in the direction of
the trade. Fundamentally, the Chinese economy is open and growing. the CCP has resisted the
urge to raise prime rates as compared with Western central banks. ( BABA and NIO have
good current price action.) Given the guidance of the chart, YINN seems to be a
good long trade I will continue to add to the trade when the chart tells me the time is right.

Is YINN ( Chinese 3X )ready to re-enter or add to the position?YINN is shown here on a 15-minute chart. It had several good NY sessions in a row adding about
4% daily. In the last session however, it had a 3% pullback to its present price. Fundamentally,
the Chinese central bank in just the past few days, lowered the prime rate something the US
fed has been unwilling to consider. There can be little doubt that this will be helpful to
Chinese stocks overall. On the chart, I find several confluences that give YINN support and
so make it likely that YINN will have a bullish continuation:
(1) it is currently at the same value of the POC line.
(2) it is currently near to the convergence of the SMAs 50 20 and 10 from the
Alligator indicator
(3) it is sitting just above the line representing one standard deviation above
the anchored mean VWAP
Given these confluences, the support is strong favoring my analysis that YINN is ready
for me to add to my position which was very profitable when I took a partial closure
of my shares at the beginning of the last trading day. I am confident that the buy
high and sell higher in an uptrend is the best approach to gain with low risk.

Apr/2023 Plan for YINN. Plan A: Sell Put Option $35 monthly (4 weeks ~ 30 days) to earn premium income 4-5% the collateral fund.
Plan B: I'm willing to hold YINN $35.00 for long term and write cover call to earn 4-5% premium income every month + dividend income.
$35 is the Order Block (OB) level in the Weekly TF.

BABA @ Long Term SupportOn the 4H Chart, BABA is sitting in the the demand zone at a double bottom retest. Earnings
two weeks ago beat expectations. Fundamentally, China is holding interest rates down and
may even decrease their prime rate. Domestically, chaos continues with more rate increases
possible and the debt ceiling issue impending resolution versus diseaster. I see trading and
investing in foreign based intruments such as BABA , NIO along with ETFs diversified into
China, Europe, Korea Japan and maybe others to be a useful means to diversify risk. I will take
a long trade in BABA because I believe it will rise from its usual bottom.

YINN | China LONG | BounceThe fund, under normal circumstances, invests at least 80% of its net assets (plus borrowing for investment purposes) in financial instruments, such as swap agreements, exchange-traded funds ("ETFs") that track the index, securities of the index and other financial instruments that provide daily leveraged exposure to the index or to ETFs that track the index. The index consists of the 50 largest and most liquid public Chinese companies currently trading on the Hong Kong Stock Exchange. The fund is non-diversified.

YINN China Leveraged 3x Bull Setting Up Reversal ShortYINN the China Bull EFT has uptrended dramatically of late however
it is far extended above its moving averages while the RSI indicator shows
decreasing strength as a divergence. Price rise is hitting the resistance of
the POC line of the intermediate-term volume profile where sellers will
step in and invoke selling pressure in a triple top making the resistance strong.
I expect it to drop now and perhaps dramatically,. Inversely the YANG
ETF, a bearish leveraged fund will rise. By a Fibonacci analysis, a 15%
drop is expected before another inflection. Accordingly, I would set
up a stop loss of 3-5% on the short swing trade setup .

Yang for Jobs reportMarket moving too fast, Fed notes and no layoffs for Christmas means bear move. Friday will be a nice buying opportunity though for some tech stocks.

YANG China 3X leverage Bear ETF UptrendAfter uptrending from a double bottom ealier this month,
by the volume profile YANG looks to recover to 26.85 which is also a good 50% retracement of
the down trend. Moreover, the uptrend could extend to a second target about 32.
This could be a good swing long setup with a great reward for a small risk if setting
the stop loss just below the POC black line at 17.25.

YINN China 3X Leverage ETF Reverses off the bottom Swing Long
AMEX:YINN YINN is now in an uptrend with an increasing cloud score
and upgoing BB boundaries. Stop Loss at the double bottom
while the first target is the recent consolidation period
with about 15% upside to that take profit and about a
2.5 Reward to Risk
All this makes YINN a candidate for a swing long trade

YINN China Bear #X Leverage ETFAMEX:YINN
China has had lockdowns, trade wars, delisting and
so on yet it hangs in there,
The YINN ETF downtrend is in early reversal.
An entry point may be soon RSI provides
confirmation.

LABU LEVERAGED BIOTECH ETFThis Daily Chart plots LABU to LABD ratios over time. LABU is 3X Leveraged ETF of a variety of biotechnology
stocks while LABD is the inverse.
By plotting the ratio of LABU to LABD, what can be found is the precise end of the LABU downtrend (LABD uptrend)
and reversal into LABU uptrend ( LABD downtrend).
In this case, the reversal occurred about June 17th while the SPY reached its current market bottom.
This type of analysis can be used to make trade decisions regarding a contrasting pair of stocks or forex pairs.
It makes the decisions more informed. IF going down to a 1H or 4H timeframe, the accuracies will be higher
and the pivots more frequent also making potential profits higher.
This can be used with other ETF inverses such as
GUST /DRIP
BOIL /KOLD
JDST / JNUG
YINN / YANG
SOXL/ SOXS
FAZ / FAS
TMF /TMV
By setting up all of these also with alerts such as ratio decreasing or ration increasing
a trader with very little time to trade and diversify and automate his/her trading
resulting in risk stratification and mitigation and economy of time.

is time for the balance of the forces yin yangi have been tracking this activity and now switching to $YINN, something good is coming guys.

IQ - Another beat in earnings?IQ is the "youtube" of China.
Last Quarter, they said it expects third quarter revenue of $1.18 billion to $1.25 billion.
The daily chart is a bottoming pattern, similar to $VIPS I just posted.
The POC is $15, I am looking .618 retrace to $11.95
Options - Its fairly even with put call ratio at .97, with $9.5 call and 8.5 put with largest OI
