SPY Dancing On The Edge Of A CliffThe US markets are experiencing a unique capital shift at the moment. Foreign capital is pouring into the US equity markets and driving the US Dollar higher.
When this trend shifts - look out below.
I'm sending this warning to all traders/investors right now. Even though my research suggests we may see an extended rally phase lasting many years for the US markets - any global crisis event (think China/Asia/Russia) could blow a hole in the support we are seeing right now.
In other words, stay cautious, use stops, play the trend as very fragile and possibly strengthening over time.
My research focused on broad cycle patterns and suggests a big cycle event will take place in the second half of 2022. After that, the next big cycle event is more than 4+ years away.
That means we have quite a bit of time to trend, or move into a disruptive phase, over the next 4+ years.
Pay attention.
Ym

ES - 1 Hour / Pivotal Timeframe - BONDS DivergingWE REMAIN IN A BEAR MARKET, regardless of the Retracement.
The 50SMA is 35 handles below the 200SMA.
Bullish?
Definetely not.
That said, the Riggers on the Trigger will continue to bleed out every
last cent prior to the next sudden and very sharp decline.
For now they have the Ball, but "Inflation is at Zero" from the Admin
has found new heights of perceptuion management - Absurdity.
_________________________________________________________________________
After the 199 EMA tag n' bag, a defensive retracement on Profit taking.
Under the hood, the Volumes continue to decline, Retailers continue to
add Puts citing the VIX @ Lows.
Dr. Bury, deep drawdown on Scion's Puts.
FOMO on the FED Pivot has hit 92% Sentiment for Bulls, room to run as
the horror show can extend and pretend for a few more weeks. Extreme
Greed is in trade.
Twitter is filled with the usual Buzz Lightyear overreach, "Infinity~!"
While MBS remains - NO BID and Defaults are rising rapidly.
Bond Auctions - 379 Failures.
_________________________________________________________________________
Insiders buying on Share Buy Backs, Insts peeling it off ever so slowly.
Unfortunately, Retail Put buying is back to FOMO as well - a large short term
cross-current.
It appears to be a Distribution phase into a Range... where is the range?
That will depend on today's response to the FOMC's Meeting Minutes.
A larger Pullback is due, there are 7 Gaps below, how will today and Friday's
expiry trade out? High Probability - ranging to wreck Retail's Bearish positioning
with an expanded range now that 4337 was front run for SEP, DEC blew right thru
this level.
Apple's Gap @ 175 wants a fill, Tesla is a mental patient once again, seeking 1030
to 1050 in the break - this implies the 4337 may give way to a higher high into
the pivot for time, AUG 22nd to SEP 4th/5th.
_________________________________________________________________________
Slop, Chop, Pop & Drop - the RANGE.
To Distro more Junk & Co.
_________________________________________________________________________
Bonds are not buying it... as they are watching the inversion with disbelief as China
begins "enhanced lockdowns" and Global Economic activity implodes... yeah, naw, they
are calling Bullsh_t.
Inversion is 12 Bips away on the 1's - 2's on out to 5's checkmate - Inverted and although
they are ranging between 32 and 48 Bips... it is 100% persistent.
HGY - Denegerate disbelief, Bonds should not, in any way be acting as they are were this
a Bull Market or New Bull Market... it tales time to assert reality. It takes time to Distro
off all the Junk bought near the lows to be re-liquified at a time when Liquidity is simply
evaporating due to the crushing load of debt, both public and private from all corners.
Housing Starts were another disaster, retail sales - with Back to School may shows signs
of hope, false hope, but hope none the less, we shall see how the Cooks in the Kitchen
serve it up.
_________________________________________________________________________
RTY / ES / NQ / YM made extreme moves off the June 16th Pivot.
Today, we'll find out whether we consolidate in an expanding range or simply run through
resistance to higher levels - A rally no one understands, but FOMO Degens do not care.
September is ahead, statistically - the worst month of the year.
Funda's are not driving Junk & Co, greed and fear are. Mo $, Fear of Mo $ miss.
_________________________________________________________________________
In SUM, it's a dangerous Joke of an Equity Complex that will do far more harm.
Hyper BK Junk BBY, GME, AMC, COIN all finding Uber Luv. We've seen this time and again
and the ending... the song remains the same.
_________________________________________________________________________
Extreme Patience remains the stock in trade.
NQ Summation and OSC's are getting squeezed to extremes once again, point critical
has arrived.
The 2 Year (2YY Futures) will define the Pivot, where the Fed has a modicum of control
on the Curve.
TLT appears to be an "M" for Murder and not a New Bull Market, it can RT to 130, but given
the recent performance, that trade is growing long on hope, faith and success. The DX
is at a super critical level - with Eurodollar Futures GED.X cranking back down, somethings
going to Snap.
A great deal hinges on Crude Oil - 85 to 77 to 64 is the implied lower range over time... awhile.
Oil tends to lead the declines in Bear Markets as Utilities, Healthcare and Bonds are the rotation
on schedule.
_________________________________________________________________________
RESISTANCE AHEAD OF NEWS is where we are.

For all traders in this market, especially buyers, For all traders in this market, especially buyers, the ban in the coming days, where a group of indicators indicating the price decline will meet, as the price rebounded on the resistance twice and a reversal candle was formed in addition to fading and equal to the last two columns of the (MACD) indicator
(YM)

Fahrvergnügen - The Traders VehicleTrading pleasure abounds as the FED's non-sense continues unabated.
A thrill ride out of Bear Market Territory for ES 3849.50, the NQ was the
laggard at 13414.
13392 the larger Pivot for the NQ Futures, a hidden one, but the DOM suits it
rather well.
"Exiting the Bear Market" is the new mantra, narrative, and fresh bullhorn
as we see "Inflation - Come Off" - Bloomberg 24/7 now.
A chortle of whores and pimps, typical and to be expected as the Summer Solstice
trade grinds on trapping goblins everywhere on the Tape.
Ignore the shortages of refined energy products, food, and the things we need
to conduct our lives.
No, lookie over here easily distracted, memory short degens.
____________________________________________________________________
The FED took off $14B week over week - at this rate, the FED is never going to hit
its "Target" @ $90Billion in QT beginning in September.
Uber Doves - Khardasian, WIlly, and Bob Evans chicken all decided to don push-up
bras and assure us they mean business... Bullard blew an Esmerelda, again.
Fed Fund Futures have more intray-week volatility than the VIXen.
_____________________________________________________________________
VX Complex - utterly sh_t mixed... but... and there is a very large butt.
Vol of Vol is showing signs the Big Lick is developing for a very large return of
Volatility.
Count on it, plan for it... here is why.
The next decline will have a Scope, Scale, and Velocity - unlike the January decline.
It will be extremely destructive in very short order for Price.
August 22nd to September 4th appears to be in line with expectations.
VX Calls carry a massive Prem... obvious expectations.
Yes, ahead of selections for Mid-Term grifters.
______________________________________________________________________
The FED is now indicating a "Panic Cycle" (of course it's not) it's simply when they
are now pandering to January as the "oops, we broke sh_t"
They made it very clear in the FSR that they wanted a 50% haircut... they be serious.
Central Bankers Globally are getting a Tate-sized Master Class of MLM from the EuroDollar
Primaries... the DX shortage will be extreme in the extreme.
______________________________________________________________________
When Brown Brothers Harriman is looking for a DX collapse... look the other way.
_______________________________________________________________________
EuroDollar has one more Chart Print to the Next Plunge.
Crash Landings... are not survivable.
Sellers of DEC 2022 and MAR 2023 on ES NQ MYM RTY.
Lots and Lots of spicy Poots to round out the Meme and FANG fade.
When Turbines SIEZE.

Dow 4 hour = fibo 61% show dow going to 34000exclent NFT news on friday , will push dow up this week !!!
if you have old sell , in deep hedge them and wait (never close buys frist)
strongly advice looking for buy , dont pick sell (only under red arrow +pinbar comes SL=pinbar high)
in 35200 we have powerfull support too , dow will see it too
i wish you win , stand on very very low and fix size
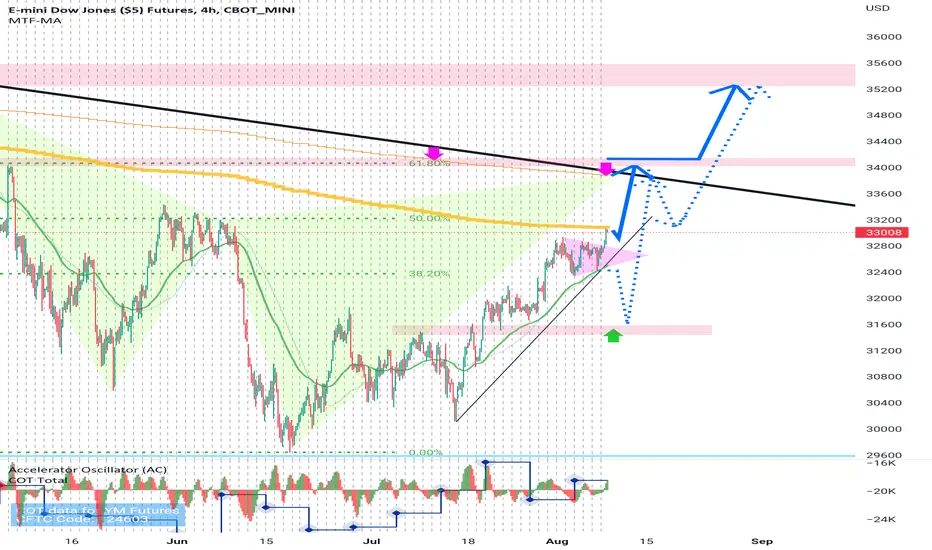
Dow 4 hour = upper target is 34000above green arrow we can pick buy (after pinbar comes on 1hour or 4hour or daily chart with SL = 100 point TP=33800 (under trend line)
ADVICE = DONT PICK SELL , LOOKING FOR BUY IN DEEP WITH SL IN DAY LOW OR 100 POINT
good luck

ES - Monthly Risk Range / Impending COLLAPSE2007 Levels will be upcoming into October 2023.
Summer Counter-Trend has more room for the upside.
The Monthly Risk Range is at extraordinary risk.
"Others" are getting it all together for the Early Fall Classic.
Extreme patience is required for the SELL, it will continue to
develop over time, blink and you'll miss it.
Financial Media continues to caution Bear Market Rally
without mentioning the extremes to which they can and
have occurred @ 10 - 21%.
This one will fail as well as PE's become even more distended
and detached from the collapsing NET's and forward Sales.
Summer has always been the time of year for Wall Street to
begin the next Grift, this one is no different.
Cyclically - 8 weeks from the Weekly Pivot for time lined up
perfectly within the 112 Week Cycle (111.8) with 2/3 weeks of
Wally World left to complete.
$2 Trillion in Pocket lining Stimmy for the "Others" and the
Assault Weapons (Rifle) debate on tap. Pelosi (CCP Ladyboy)
suggesting a visit to Taiwan is in order... A FED who appears to
prefer confusion and delay ahead of the Greater Collapse - all
the while destroying the Labor Markets, while Buffet and his
ilk prepare for Sharecropping the Sheeple.
__________________________________________________________
The Investment Establishment continues to maintain a balanced Portfolio
of Stocks and Bonds - 90% of the Industry.
Independents beg to differ, they believe avoidance is the optimal strategy.
Risk On versus Risk Aversion.
___________________________________________________________
Goldman Sachs predicted a 14% rise in Equities into 2008, December of
2007 it collapsed 36%.
Wall Street setting the expectations for Greed once again, but failing to
deliver sans a more massive wealth transfer - deliverance.
The 2 main reasons are quite simple:
1. Status Quo Bias - Unwillingness to accept the 10%, only the 90%.
2. Cognition Bias - Confirmation Bias that filters existing preconceptions.
______________________________________________________________
Numbers never lie, however, fudged they may be.
Lying is part and parcel of the Grift.
56% at minimum will come off the Indices in the first leg lower. It will head
far lower over the coming years exceeding the 4-year 90% cycle during the
Great Depression, this will be far greater.
Concentrations are trending further towards non-representation of Humanity
form every point on the Arrangement Curve.

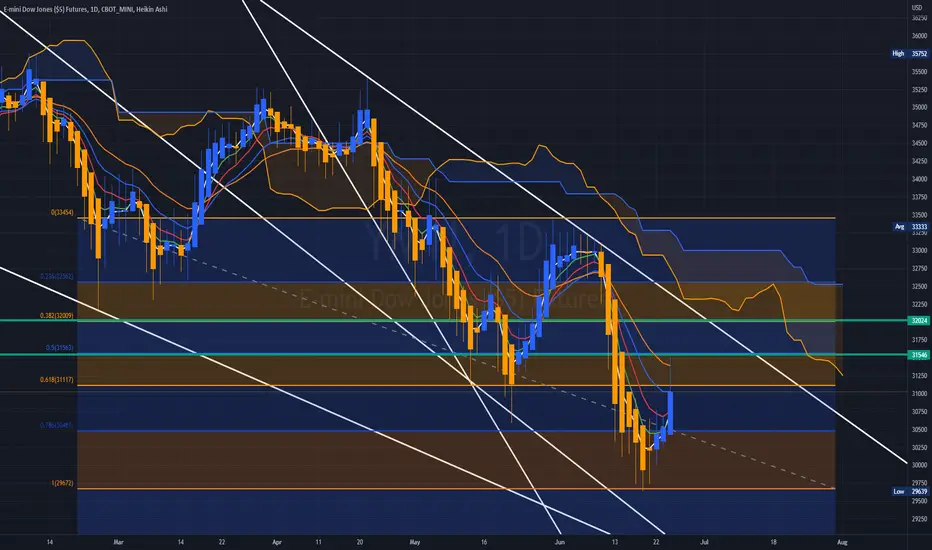
DJI to $14,500 in July 2032?Do we revert to the 50 year mean in 2032? That would put the Dow at 14,500 in 2032 if the cycle repeats.
Found it very interesting that it was exactly 50 years to get a low & bounce from the Great Depression bottom.
Every mega bear market is different so IF this is the start of another mega bear market that takes us to the lower blue line on this log chart then I doubt it will be labeled "Great Depression or Stagflation".
Great Depression-Lasted 3 years
Stagflation-Lasted 16.5 years
Jan 2022-July 2032=10.5 years (16.5+3=19.5 years and then divide that by 2 and you could conceivably say 10.5 years of whatever we will call it does make sense from a timeframe perspective).
Either way, IFFFF we are in a mega bear market the chart won't look identical to either the Great Depression nor Stagflation...it will have it's own uniqueness and it's own name.
For now, I'm just looking for the open weekly gaps on the DJI to get cleared seeing as those have ALWAYS cleared. Open weekly gaps are at 28,495.05 and 24,718.46

Elliott Wave View: Dow Futures (YM) May Pullback SoonShort Term Elliott Wave view in Dow Futures (YM) suggest that rally from 6.17.2022 low is unfolding as a double three Elliott Wave structure. Up from 6.17.2022 low, wave W ended at 31867 and dips in wave X ended at 30109. Internal of wave X unfolded as a zigzag structure. Wave ((a)) ended at 30331, wave ((b)) ended at 31490 and wave ((c)) lower ended at 30109. This completed wave X in higher degree. Wave Y is in progress with internal subdivision as a zigzag structure.
Up from wave X, wave (i) ended at 30726 and dips in wave (ii) ended at 30495. Index extends higher in wave (iii) towards 31264, wave (iv) ended at 31113, and final leg higher wave (v) ended at 31614 which completed wave ((a)). Pullback in wave ((b)) ended at 30949. Wave ((c)) higher is in progress as a diagonal. Up from wave ((b)), wave (i) ended at 31980 and pullback in wave (ii) ended at 31504. Index then extends higher towards 32193 to end wave (iii). Expect wave (iv) pullback to end soon, and Index should resume higher in wave (v) of ((c)) to end wave Y. Potential target higher is 100% – 161.8% Fibonacci extension of wave W from 6.17.2022 low. This area comes at 32321 – 33691 where sellers can appear for further downside or 3 waves pullback at least.

Consumer Sentiment / Without Question - C R A S H Dead AheadThe Greatest Bubble in History is unwinding with fits and starts.
Economic Conditions Globally - within the lower 3% Historically.
Multiples for Equities - within the Highest 4% Historically in very
Real Terms.
Monetary & Fiscal Excess - The Greatest in History, bar none.
100% Assured:
Reality is brought to bare with the Consumer who is being squeezed
like a sponge, wrung out and left to dry up, wither and dustify.
During the 1929 Crash, it was the Industrial Centers of our Productive
Economy who observed the Level of Commerce, Euphoria and
Distended Prices... they Sold everything that was not nailed down.
It was not Wall Street - why would they end the Great Game of
Wealth Transfer. They would not.
The Public merely piled in and joined the Selling.
When Confidence fails, it is over for a generation.
That was then, from the early 1980s our Economy began to shift
to a Tertiary, Consumer-based arrangement.
Irrational behavior merely follows suit upon the False signals provided
via both Monetary and Fiscal Policies, provided the Drugs to imbue
speculations.
It has been the exact same throughout recorded History. Human
behavior and incentives never actually change.
The shift to a Consumer-based Economy was temporary. Great Wealth
was accumulated and squandered under the privilege of Dollar Senioarge.
Eventually, the dislocations become evident, often decades later.
Observe the Financial Environment, the final stage of Crazy is unwinding.
There is much further to devolve, there is no outcome that will be
tenable to the vast majority of Humankind.
All that is required is a loss of confidence in the "Systems" - we see
this is taking shape in the very Pillars which support the failing Systems.
We no longer have an Industrial Sector of Scope and Scale, but rather a
series of Financial Arrangements that are no longer sustainable by any
metric.
The Can Kick... it's ending - Sooner than later.
Wall Street follies at this juncture can and will be even more extreme,
count on it as there is nothing left but wild dislocations, absurdities and
further Lies, Corruption, and Greed to unravel.
__________________________________________________________
TV is missing a large amount of DATA, get it together TV.
Recently there have been a number of Prints @ 50. It is far lower
than the half-baked UMich Numbers.
__________________________________________________________
What has caused every Crash of larger proportions?
Sentiment, the Investing Public pulls the trigger and Exits.
Insider Sentiment Peaked in March and remains unreported past
April 2022.
__________________________________________________________
We will see a Crash unparalleled in our lifetimes.
It is approaching with absolute certainty.

Showcase: A quick trade on e-mini Dow Jones (YM, 25 July 2022)I recorded the video abit late:
There was a nice pullback formation earlier and if you look on the left side of the chart, you can see the price was on downtrend before it made a reversal with high vol. (indicated in the video as SO, which is actually an SP based on the bar characteristics).
I did set my EP at 31282 but the price volatility caught me off guard and I emotionally entered on market price. Eventually price went down to capture my earlier EP level before continue moving upwards.
We managed to exit with 25pts profit for holding of less than 10mins. This shows that having a proper background and entry on Pullback would yield a good return; bear in mind that in Futures, you need to enter in and out quickly.

Showcase: Upward Trend in e-mini Dow (5mins chart, 22-07-04)1. Price was on the uptrend with the low getting higher and price increase accompanied by increase in volume.
2. Entered Long with a wider SL but TP @ next Resistance level.
3. Will share the outcome of the trade in the comment.

YM1! Short PositionAccording to my strategy YM1! will encounter following scenario in Bearish market:
Sell Limit 1: 32350
Sell Limit 2: 32500
Sell Limit 3: 32900
Tp1: 31250
Tp2: 30175
Tp3: 29700
SL: 33400
R/R: 7
You Can make profitable trades only if you be careful about your MONEY MANAGEMENT Strategy
Patience is the key of making money.

MBS - The Darkest end of the PoolBravo TV, off again by over a Trillion, no mention
of the Junk Co sitting on Primaries @ $50 they cannot
unload.
FED MBS is $2.7 Trillion.
Commercial Banks hold $3.13 Trillion in MBS.
Get it together.
____________________________________________
NO BID is the current arrangement, 30 Year Mortgages
up from 3 to 6%.
The Fed's average Maturity is 7.1 Years, they'll be bagging
these for some time and in order to bail out the primaries
they'll have to suck up more.
OR they can crash the Bond Markets.
They'll attempt to run it off, but they own 28.2% of all
Mortgages.
The Bond Market is performing the FED's work, cuz the punks
at the FED have no intention of powering in QT., rather, much
further instability and dislocation Risk.
______________________________________________
THE FED IS TARGETING STOCKS for a reason... Thye need a
Inverse Wealth Effect and are winning on that front. Much more
to come... FSR is a 50% reduction @ 8K NQ and 2.4K ES.
______________________________________________
Growth, Payrolls, Retails Sales?
Fight Inflation? Give us 75 to 100 in July.
Bring down Equities to targets and transfer the Wealth.
Far and away the easiest "Target" is the Market for Stocks.

DOW - YM Ketchup28.2K and 24K await... it's simply a matter of time.
Industrials for the Post Industrial Co-Dependent Economy
are being Sold as if there is no tomorrow...
Nothing like a solid lift to re-enter the Trend, which is Down.
Counter-Trends are nasty Bed Fellows.
3M, Dow, and a great many of the glory days Equities are
being dumped on the heads of Ma n' Pa.
Dividend-paying Junk Co frankly makes sense for them... for now.
CD Rates did not decline in the most recent TNX Pullback.
Banks are now more hated than ever.
Brokers are in the lead, though as Passives are frankly the new Index
Funds of the early 2000s - CLick this and that, whammy, Ron Burgundy
would be proud.
Stay Classy INDU.
Stay Classy.
Showcase: Trading the e-mini Dow Jones (YM) 22-06-201. Did a long trade (paper trading) on e-mini Dow Jones.
2. Reason for the long trade:
a) Price do a higher lower; a UT bar appears but the next bar overtake the UT.
b) Volume is supporting the upward move.
c) Strong support level at 29910 range.
3. Trade entered with SL @ 50pts and TP @ 75pts; as price move upwards with unrealised profit, the SL is revised upwards to minimise the losses and eventually lock-in the profit.
4. Price eventually do a pullback after breaking the recent Resistance (29966 range); our SL got hit and we exited with a realised profit of 24pts.
5. Price may move upwards from hereon; it is OK to exit with a small profit rather than be ambitious.

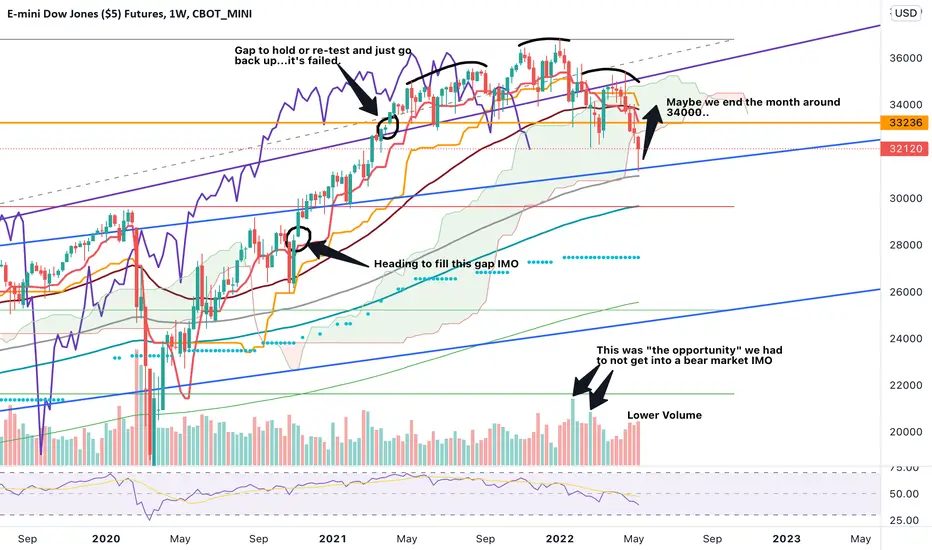
We can't go anywhere without the DOWI was a bullish hopeful at the start of the week...I was thinking we would fill the 4K gap on the ES and then just go. Instead we spent 4 days closing below this figure. Yes, we closed the week above it and kept the lagging span just above the cloud but we cannot go anywhere with the DOW and this chart says it all. Neckline is clearly broken. Now, I do think we could have a minor rally to end May with a possible green monthly candle.
The charts are clearly broken and will have limited re-tracements IMO.
The NQ & RTY are in bear markets, enough said there.
Sell the rip....
SPY/SPX/ES/MES Elliot Wave AnalysisLooks like a big rally shaping up to end the month of May, but June should be a full-on bear fest, at least to start the month. Major Wave 1 down should end in the 3200 - 3500 zone. Likely, we'll rebound from there into the Fall of 2022.
Major Wave 3 will likely project down to the 1500 zone. Major Wave 5 will likely end in late Spring 2023 with target projections somewhere between 1500 - 1200 with a very real possibility of undercutting the 2009 low @ 666.
If we do undercut 666, supercycle Wave 5 up should begin, lasting 8.6 years into 2032 and reaching 50k to 100k + on the Dow Industrials. After that, it's possible the whole thing drops to zero and the shithouse goes up in flames.
Credit to Dan E. for his wave analysis and Elliot Wave International CME_MINI:ES1!
Side note - When things get super volatile, I like to trade the mini ES. Trades great with excellent liquidity.

Upside Exhaustion Move In Bitcoin Is OverThe recent bounce in the US major indexes and Bitcoin is likely very close to completion right now. I would urge everyone to pull profits and prepare for the next big wave (likely LOWER).
Fibonacci Price Theory suggests this trend is still bearish and Bitcoin would have to rally above $34,150 to start a new recovery phase.
My analysis suggests more selling is needed to flush out a real bottom. I suspect the ES/NQ/YM and other sectors will do the same thing over the next few weeks - move lower attempting to FLUSH OUT a bottom.
Pay attention to my research.

YM - DOW INDU Buzz LightyearThe Transports do not look good.
Globally - the Baltic Dry Index appears
very poor.
Sentiment for Value?
____________________________________
Bear MArket rally hats are being put on.
"Technically" it looks good according to the
"Good" or "Positive" for a CT/RT.
Have at it, enjoy the fear of no further
consequences to come... at least short term...
We'll see.
I'm certain that's incorrect.

DOW daily : buy pinbar comes , dow reach red fibo 161% (seller target) in coming days ,looking for buy with SL in pinbar low with minimum tp= 32600 or 34000 , dont close it soon ok?
if pinbar low break it little can go downer , we must buy it nnear 29700 and hold it 10 day to high
goodluck

Elliott Wave View: Dow Futures ($YM) Extending LowerShort Term View in Dow Futures suggest cycle from 5/5/2022 high is unfolding as a zigzag Elliott Wave structure. Down from 5/5, wave A ended at 31148 and wave B rally ended at 32695. Internal subdivision of wave B unfolded as a zigzag structure in lesser degree. Up from wave A, wave ((a)) ended at 32201, and pullback in wave ((b)) ended at 31778. Final leg higher wave ((c)) ended at 32695 which completed wave B. Index has turned lower in wave C. Potential target for wave C is 100% – 161.8% Fibonacci extension of wave A at 27950 – 29750 area.
Wave C subdivides as a 5 waves impulsive structure. Down from wave B, wave (i) ended at 32238 and rally in wave (ii) ended at 32651. Index then resumes lower and expected to complete wave (iii) soon. Then it should rally in wave (iv) and turn lower 1 more time to end wave (v) and complete wave ((i)). Afterwards, Index should rally in wave ((ii)) to correct cycle from 5/17/2022 high before the decline resumes. Near term, as far as 5/17/2022 pivot at 32695 remains intact, expect rally to fail in 3, 7, or 11 swing for further downside.

US30 NDSThere is no buyers moving in after fake rally against the market direction and I personally confused about the reaction of price to H+ levels but I think this H+ will fail finally and price goes to the end of symmetrical leg 3
Happy trading <3
