DOW JONES: The top is close. Pullback expected.Dow Jones is unfolding the second rally sequence of the 1 year Channel Up and has reached today the 0.786 Fibonacci level of July's High. The 1D technical outlook is about to turn overbought (RSI = 68.650, MACD = 236.580, ADX = 32.415) and as the rally approaches the R1 level (35,100) as well as being almost on the +9.05% range from the bottom, we are looking towards a late April peak formation and pullback.
The pullback is expected to be at a -2.75% minimum, like June 23rd that reached the 1D MA50. Sell, TP = 34,300.
See how our prior idea has worked:
## If you like our free content follow our profile to get more daily ideas. ##
## Comments and likes are greatly appreciated. ##
YM1!

DOW JONES Consolidation leading to a Christmas rally?Dow Jones / US30 spent all week above the 1day MA50, in fact Friday's rebound took place exactly on it (Support A at 33850).
This is potentially an Inverse Head and Shoulders pattern and with the 1day RSI at 60.00 and over its MA, it draws comparisons with the June 15th pattern, which peaked at +6.08%.
That pattern has same measurements as the current Inverse Head and Shoulders and formed the Right Shoulder in 3 weeks, supported by the 1day MA50.
After that another +6.15% leg brought the price to the 1.786 Fibonacci extension.
Similarly, the current Inverse Head and Shoulders may target the 1.786 Fibonacci, which in this case will be a little under the 35700 Resistance B high.
Buy and target 35500 (a little under Fibonacci 1.786).
Previous chart:
Follow us, like the idea and leave a comment below!!

Are we about to see a new era of expansion for the tech sector?This is the Nasdaq to Dow Jones ratio (NDX/DJI) on the 1W time-frame (with the RSI on the 1M), which offers very interesting conclusions as to where we are on the large scale of things, which can be particularly helpful now as the shorting bets have been increased to the most in 5 years.
The recent pull-back since the July Highs, have made market critics call for a stronger correction. for the NDX/DJI pair, this has just been a consolidation. Going back to 2000, the tech sector witnessed a 'biblical' Bear Cycle as the Dotcom Bubble popped. It wasn't until November 2021 that the NDX/DJI ratio reached this 0.47 All Time High (ATH) Resistance but again as we saw, the inflation crisis happened and had a 1 year Bear Cycle.
Now the ratio is almost back to the ATH Resistance and just formed a 1W Golden Cross, which is a very bullish pattern, the first since October 2007. What's really interesting is that this consolidation on a 1W Golden Cross is quite similar to the July 1991 pattern. That fractal was basically the expansion phase that led to the Dotcom Bubble burst. The 1M RSI sequences are similar between the two fractals.
This chart shows us that such expansions take place inside Channel Up patterns. The 1W Golden Cross and a potential break above the 0.47 Resistance, may be the signal telling us that the technology market is starting a new era of expansion and it won't be surprising even fundamentally. Among other technological advancements and inventions, we are in the era of A.I. and that can be the vehicle to grow the market to unprecedented highs just like the internet was in the 1990s fractal that led to the 2000 Dotcom bubble.
Do you think the time to invest in tech long-term is now?
-------------------------------------------------------------------------------
** Please LIKE 👍, FOLLOW ✅, SHARE 🙌 and COMMENT ✍ if you enjoy this idea! Also share your ideas and charts in the comments section below! This is best way to keep it relevant, support us, keep the content here free and allow the idea to reach as many people as possible. **
-------------------------------------------------------------------------------
💸💸💸💸💸💸
👇 👇 👇 👇 👇 👇

DOW JONES: Final pump before correction.Dow Jones turned bullish on its 1D technical outlook (RSI = 59.241, MACD = -34.600, ADX = 33.114) after more than three weeks as it smashed past our target and even crossed over the R1 level (34,150). The inevitable formation of a Golden Cross on the 4H timeframe, indicates that this sequence has one more High left to give on the LH and HH trendlines cross.
The 4H MACD Bearish Cross is very much like October 12th, both took off on a Double Bottom Bullish Cross. This is our last short term buy (TP = 34,500).
See how well our prior idea has worked:
## If you like our free content follow our profile to get more daily ideas. ##
## Comments and likes are greatly appreciated. ##

DOW JONES Technical pull back ahead of Golden Cross (4h).Dow Jones is on course to form a Golden Cross on the (4h) time frame within 2 days.
Despite being bullish medium term, this pattern has caused a minor short term pull back all the prior 3 times it emerged in 2023.
Trading Plan:
1. Sell on the current market price.
Targets:
1. 33750 (-1.20% decline, same with all previous cases).
Tips:
1. The RSI (4h) got overbought on Friday, as it had done all of the previous 3 fractals we are looking at that preceded the Golden Cross (4h). An additional sell signal.
Please like, follow and comment!!
Notes:
Past trading plan:

DOW JONES Above the 1day MA50 after almost 2 months!Dow Jones / US30 crossed on Friday over the 1day MA50 for the first time since September 15.
It hit Resistance A (34150) which was the October 17th High and completed so far 5 green days in a row almost at the top of the Bearish Megaphone.
The long term pattern is a Channel Up, so there is still considerable upside left.
The 1day RSI also crossed over its Falling Resistance much like the March 29th fractal, which after a short consolidation on Resistance A, it hit Fibonacci 0.786.
Buy if the price crosses over the Bearish Megaphone and target 34950 (0.786 Fibonacci).
Previous chart:
Follow us, like the idea and leave a comment below!!

DOW JONES: Started rising, at least on the short term.Dow Jones went from oversold to neutral on its 4H technical outlook (RSI = 51.457, MACD = -63.520, ADX = 28.038) as the price bottomed on the LL trendline of the three month Channel Down and rebounded straight to the 4H MA50 today. This is the short term Resistance, a closing above it confirms the 2nd part of the rally to the 4H MA200.
The 4H MACD is on the same Double Bullish Cross bottom formation as October 4th. The rally that followed rose by +4.05%. Consequently our bullish target (TP = 33,500) is under a max +4.05% range, as well as the 4H MA200 and the dashed LH trendline.
## If you like our free content follow our profile to get more daily ideas. ##
## Comments and likes are greatly appreciated. ##

DOW JONES Best buy opportunity in the last 7 months.Dow Jones (DJI) hit the bottom of the long-term Channel Up pattern by completing leg (e). This is a similar structure to the (a) - (e) sequence that bottomed on March 15. Technically this is the best buy opportunity on the index in the last 7 months. On top of that, the 1D RSI is on Higher Lows during the prices (d) - (e) wave, showcasing a huge Bullish Divergence, the first such since February 24 2022! We can't ignore however the potential 1D Death Cross formation and any bullish approach has to be adjusted short-term.
As for the target, the March rally breached marginally above the 0.786 Fibonacci retracement level, therefore giving us the framework to target 35000 (Resistance 1 + 0.786 Fib). Be careful, as failure and/ or rejection on the 34150 October 17 High, will be a bearish signal, aiming at a Lower Low, potentially near Support 2.
-------------------------------------------------------------------------------
** Please LIKE 👍, FOLLOW ✅, SHARE 🙌 and COMMENT ✍ if you enjoy this idea! Also share your ideas and charts in the comments section below! This is best way to keep it relevant, support us, keep the content here free and allow the idea to reach as many people as possible. **
-------------------------------------------------------------------------------
💸💸💸💸💸💸
👇 👇 👇 👇 👇 👇

DOW JONES Time to buy the dip again.Dow Jones / US30 reached our desired buy level based on our last idea (chart at the bottom), which is exactly at the bottom of the 11 month Channel Up.
It kept the 1week MA200 intact once again (has been since October 2022), so that maintains the long term trend bullish.
The shorter pattern is a Bearish Megaphone and as mentioned previously, our target is for the time being and until a break out takes place, inside this pattern.
Target 33600, which is under the 1week MA50, under which all of October's candles have closed.
Previous chart:
Follow us, like the idea and leave a comment below!!

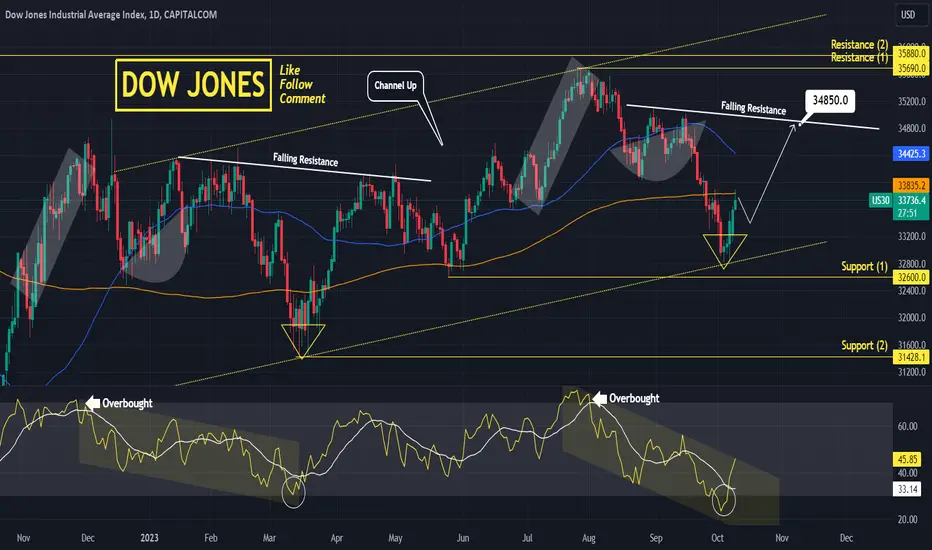
DOW JONES Best buy entry on a 7 month basis.Dow Jones is approaching Support (1) and the Rising Support of the 2023 Channel Up.
The Support (1) level has been holding for 5 months.
Based on the Falling Resistance that initated the current correction and the rejection on the MA50 (1d), the price action is identical to November 2022 - March 2023 so far.
Trading Plan:
1. Buy on the current market price.
Targets:
1. 34800 (Falling Resistance).
Tips:
1. The Sine Wave tool very accurately displays the Cycle of peaks and bottoms since late 2022 and shows the price is on the most optimal bottom buy level time wise.
Please like, follow and comment!!
Notes:
Past trading plan:

DOW JONES: Support Zone intact. Buyers are favored short term.Dow Jones is volatile on the 4H timeframe (RSI = 37.485, MACD = -170.620, ADX = 29.943) after almost testing the S1 level (32,813) yesterday but following a 4H MACD Bullish Cross formation, it is a low risk buy opportunity. The rejection of the previous rise took place on the 4H MA200, so that is our target again. Buy and TP = 33,700.
## If you like our free content follow our profile to get more daily ideas. ##
## Comments and likes are greatly appreciated. ##

DOW JONES The bottom isn't in yet.Dow Jones may be trading inside a long term Channel Up but the medium term pattern is a Bearish Megaphone.
The last Bottom of the Channel Up was closer to the 1week MA200, this time the MA level is even closer, a strong candidate for a bottom.
The previous correction leg made a -10.15% extension, a new one of this size meets almost perfectly the bottom of the Channel Up and a little over the 1week MA200.
Sell to 32400 then reverse to buying and target 33600 (1week MA50).
Follow us, like the idea and leave a comment below!!

DOW JONES: Strong short term buy signalDow Jones is on a range with the 1H timeframe neutral (RSI = 46.672, MACD = -41.790, ADX = 29.739), giving us an opportunity to buy the decline of the last three days and target the 1D MA50 (TP = 34,000). Technically this consolidation, even on 1D RSI structure which is inside a Rectangle, mimics early September. The medium term trend remains bearish inside a Bearish Megaphone but the long term bullish inside a Channel Up.
See how well our prior idea has worked:
## If you like our free content follow our profile to get more daily ideas. ##
## Comments and likes are greatly appreciated. ##

DOW JONES On the verge of a new bullish break out.Dow Jones is testing the MA200 (4h) today, after holding the MA50 (4h), extending the rebound that was generated at the bottom of the Channel Up.
This is so far replicating to a good extend, the March 15th rebound-bullish leg.
Trading Plan:
1. Buy on the MA200 (4h) break out.
Targets:
1. 34850 (Falling Resistance).
Tips:
1. The MACD On the (1d) time frame is past a strong Buy Cross, much like March 22nd. It shows that we are on the same level as when that bullish leg tested the MA200 (4h).
Please like, follow and comment!!
Notes:
Past trading plan:

Head & Shoulders Bottom in Dow Jones Futures?Dow Jones index futures has completed head & shoulders bottom formation and is exhibiting a breakout from the resistance zone on the 4h time frame. If the breakout is successful, we can expect the price to hit the previous support/resistance zone of 34800.

DOW JONES is in an expansion Cycle and people still shorting it!Dow Jones on the 3M chart gives you the clearest picture you can get.
Every 10-15 years it consolidates inside a Megaphone (fundamental reasons like war, recession etc) and then an expansion phase follows.
In the 90s this expansion phase was extended due to the uprecedented boom of Dotcom.
While the index is on its expansion phase, the RSI trades inside a Falling Wedge, which warns of the loss in bullish strength and eventually leads to the new Megaphone.
Right now it is obvious that we are in an expansion phase. Needless to say it will last for as long as the MA50 holds.
The real question is will it be short like in the 1950s or extended like in mid 1980s-90s?
Follow us, like the idea and leave a comment below!!

DOW JONES May be starting a new Bull rally under our nose..Dow Jones (DJI) is printing on its RSI on the 1W time-frame an astonishingly symmetric Higher Lows pattern as 2015/ 2016. As with today, the price was within a Rising Wedge at the time, making a fake-out bearish break but still was emphatically supported by the lower Bollinger. In fact the Bollinger Bands have been instrumental in containing the price action.
It we are indeed (based on the 1W RSI) on a bottom similar to October 31 2016, then a very aggressive Bull rally is about to begin. And as always the majority isn't taking notice.
-------------------------------------------------------------------------------
** Please LIKE 👍, FOLLOW ✅, SHARE 🙌 and COMMENT ✍ if you enjoy this idea! Also share your ideas and charts in the comments section below! This is best way to keep it relevant, support us, keep the content here free and allow the idea to reach as many people as possible. **
-------------------------------------------------------------------------------
💸💸💸💸💸💸
👇 👇 👇 👇 👇 👇

DOW JONES Small pull back on the cards.Dow Jones hit the 1day MA200 yesterday and failed to close over it.
As a result, the price got rejected and started pulling back today.
Based on the 1day RSI, we could be in a minor corrective candle similar to March 22nd, which found Support between the 0.618-0.786 Fibonacci range.
Buy on the 0.618 Fibonacci and target 35000 (Resistance A).
Previous chart:
Follow us, like the idea and leave a comment below!!

DOW JONES has considerable upside potential targeting 34850.Dow Jones touched the MA200 (1d) today after bouncing off the bottom of the Channel Up.
This is a standard V shaped reversal, much like the one in March.
Trading Plan:
1. Buy on the next MA200 (1d) break out.
Targets:
1. 34850 (Falling Resistance contact in similar fashion with April 14th).
Tips:
1. When the RSI (1d) is rebounding after being oversold, which is what took place on the March 13th Low. The two patterns are identical, this is why we expect the same target symmetry as then.
Please like, follow and comment!!
Notes:
Past trading plan:
Forget Soft, Hard Or No Landing, Higher For Longer...Is the Stock Market Dead Money For The Next 10-20 Years?
So much of how our markets work is based on optimism. Can you imagine being a money manager and your entire sales pitch is some negative diatribe about how the market is going down and will continue to go down?
Would you fork over your hard-earned savings based on such a story? Not a successful plan of attack for a person trying to raise capital if you ask me.
However, therein lies the disconnect between what is really going on in today’s market, versus what the average person reads and hears in the financial news. The same optimistic money managers sponsor those articles or those TV shows. Would your business buy an ad on a show or in a magazine that constantly gave a negative outlook on your business?
I’ve always considered myself an optimist. However, nowadays, I find nothing to be optimistic about with respect to the US stock markets. The reason is, my prevailing analytical thesis is, the markets are now entering a long-term cycle in which many aspects of our economy will be reverting to their respective long-term mean. From interest rates, to income inequality. This time frame, I refer to, is meant to be a reset in expectations. If I am correct in my analysis, this will unfold over a long period of time. During this period, many of old correlations and metrics used to determine the value of the stock market, assets in general, (housing, for example) will break down and end up becoming less useful to those who fundamentally analyze assets, stocks and the markets for a living. The cycle I am referring to is one in which none of the current market participants have experienced. Now before you draw a hasty conclusion, and think this article is about me warning you, the reader, a 1987 stock market crash scenario is on the horizon, I’ll caution you. It is not.
However, my analysis shows that the market will essentially become dead money for at least the next decade or two. That means buying most market-based asset classes, and holding them, will not produce the desired results of the past.
Please indulge me while I provide some background and explain.
I practice a form of market analysis that is exclusively focused on price action. I guess you could sum up my work by styling me as a pattern analyst. That means stock market news, events, corporate earnings and all external data is of little concern to me as I carry out my day-to-day analysis on the SP500. I never take those external events into account while analyzing any of the markets I cover. I watch the patterns market participants create with their buys and sells. I study those patterns across the many markets I cover and over both the short and extremely long periods of time. One could say I took my mother’s advice to heart, and watch what they do, not what they say. It’s the law large crowds, and the larger the crowd, the more accurate the forecast. The SP500 contains one of the largest crowds assembled. Each day it involves millions of participants, exchanging large volumes of assets for vast sums of money. Suffice to say, my work can produce some scary accurate forecasts based on the participation of the crowds in those markets.
A final anecdote to explain my work lies in a simple experiment I observed some time ago on YouTube. To illustrate the power of large crowds, a YouTuber decides to conduct an experiment. The individual fills a large mason jar with marbles. The half gallon sized mason jar is now brimming with marbles, and the metal lid is twisted on, sealing the jar. The individual then attends a local carnival and sets up a booth to solicit guesses as to the total amount of marbles contained in the mason jar. Volunteers are asked to simply observe the jar, and write down their guesses on a post-it-note. After collecting a large number of post-it-notes, the guesses are entered into a spreadsheet. Next, the marbles are emptied on a carpet and counted. 1340 marbles. Comparing the spreadsheet data, the conclusion was, although some volunteers came close in guessing the correct number of marbles, no one guessed correctly. Guesses ranged from as low as 300 to as high as 3,000. A seemingly random data set. However, under further examination, the average of the total guesses were 1335 marbles. This simple experiment explains the legitimacy of some sort of “inexplicable collective consciences” when involving a large crowd.
My current bearish perspective manifests itself in this same notion of the large crowd of market participants but over an extremely long-time frame of the SP500 (INDEXSP: .INX).
Below is a chart of the price action of the index from inception.
To put a simple explanation on the chart above. Since the stock market crash of 1929, the price pattern of the SP500 has essentially advanced in a 45-degree angle higher. I will spare you my explanation of the labeling of the chart as to not bore you as those details do little to further my explanation of the analysis. However, I will state that all our society has achieved since in the last 150 years is notated on the above chart. The advancement of technology, medicine, communication, war and peace is all included. For me, this becomes a visual picture of some of the best and worst times humanity has experienced during this time. What is compelling, is some of those pivotal moments barely stands out on the chart.
Fast forward to today.
After almost a 100-year price advance from the 1929 crash, we are now entering a prolonged period of digesting all those gains. I cannot over emphasize that this area of consolidation I forecast is 100% natural and should be no cause for alarm from a pattern analysis standpoint. As stated, that is a simplified explanation of what a super cycle event wave (IV) accomplishes. Additionally, our last Supercycle event, labeled (II), is an area of digesting gains that was hastened once the events of the Spanish Flu of 1918 were behind us and that pent-up demand was unleased. In the US, those times are referred to as the roaring twenties. Cyclically there are many character similarities in our wave (II) and our current wave (IV). Chief among them was a global pandemic and the aftermath. However, in my form analysis, a wave (II) and a wave (IV) are supposed to alternate in terms of time duration and retracement depth. If one takes place over a short period of time, the other should be long. I can see this sort of alternation I refer to take place every day, as it pertains to the very short timeframes. These patterns, whether long or short term, tend to be fractal in nature. Meaning, if you removed the dates and timeframes from a 1-hour chart of the SP500 and a 150-year chart (like the one displayed above) they would look strikingly similar. To a pattern analyst, like myself, I would be unable to discern what timeframe I was looking at. Nonetheless, the patterns would be instantly recognizable. Because these fractals form and complete on the smaller timeframes, through observation we can forecast the same effects on the much longer time duration charts. These fractal patterns tend to be self-similar and repeating.
In conclusion, if what I see unfold each and every day is indeed similar and repeating when observing a price pattern that is 150 years in the making, the conclusion will be a decade or two of dead money due to a long-term cyclical digestion of gains. Call it a “massive reversion to the mean event”. From things like interest rates to income inequality, a total reset to longer term norms.
Additionally, if my analysis is correct, the January 2022 stock market highs will not be breached for a very long time to come. This will be a time where investors will be forced to become more creative and pickier, as it pertains to seeking a return on capital.

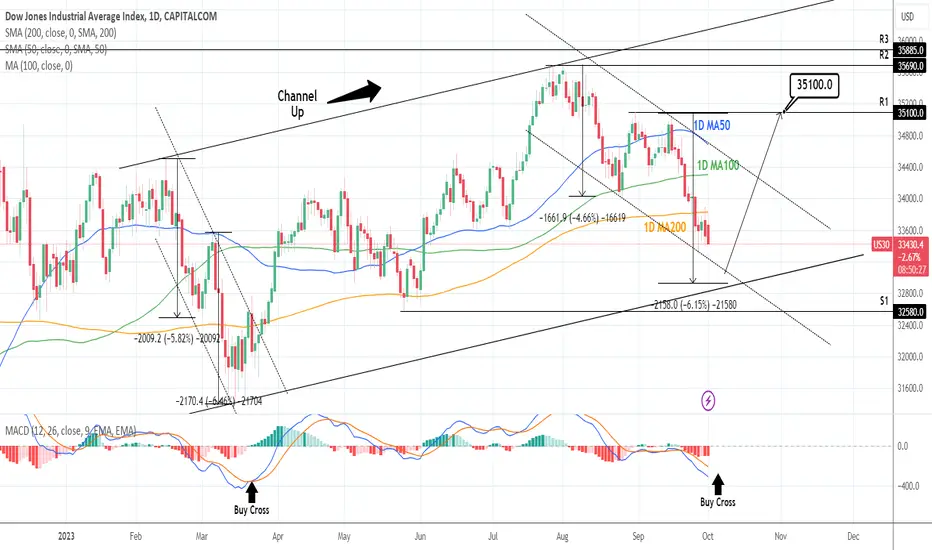
DOW JONES: Failed on the 1D MA200, further decline possible.Dow Jones failed to close Friday's 1D candle over the 1D MA200 and opened the day lower. The 1D technical outlook remains bearish (RSI = 33.039, MACD = -323.740, ADX = 47.730) as the medium term Channel Down is still holding. A crossing over the 1D MA100 reverses this. Until then we can expect the decline to continue until it tests the HL trendline of the Channel Up or better yet the reversal is confirmed by a Buy Cross on the 1D MACD. A potential rebound there targets the R1 level (TP = 35,100).
## If you like our free content follow our profile to get more daily ideas. ##
## Comments and likes are greatly appreciated. ##
DOW JONES Bottom formation buy only on the short term.Dow Jones is priting a bottom on the newly emerged Channel Down which calls for a short term buy.
The same kind of formation was witnessed in middle March on the long term bottom pricing when the (recently broken) Channel Up started.
Trading Plan:
1. Buy on the current market price.
Targets:
1. 34400 (MA50 1d).
Tips:
1. The RSI (1d) is on the 30.00 oversold support. Same as on March 13th. An additional buy indicator.
Please like, follow and comment!!
Notes:
Past trading plan:
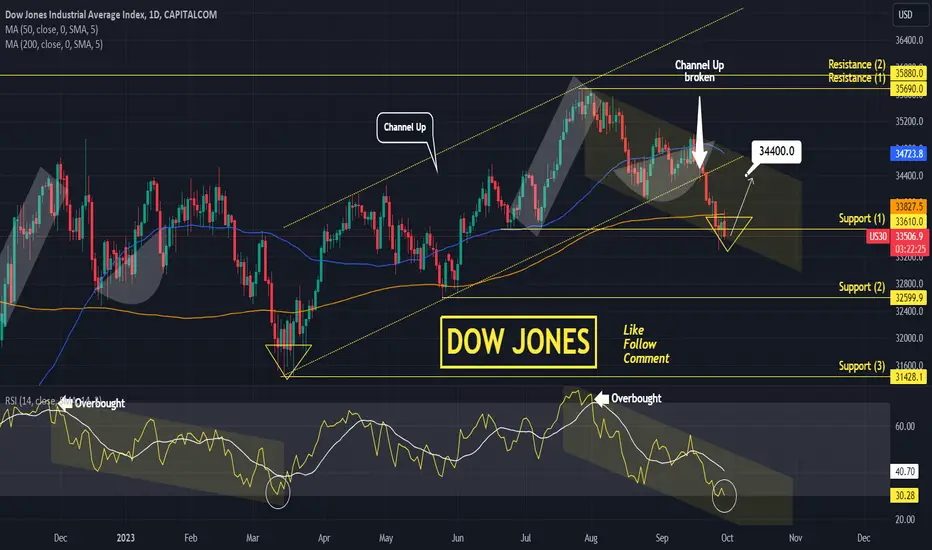
DOW JONES Channel Down bottom buyDow Jones / US30 hit the bottom of the Channel Down that is correcting the index to the Rising Support of the larger Channel Up pattern.
It did cross under the 1day MA200 (bearish) but on the other hand the 1day RSI is rebounding on the Oversold Support (bullish) like on the March 13th low.
Keep a tight SL on the low of the bottom candle and buy. Target 34400 (1day MA50).
Previous chart:
Follow us, like the idea and leave a comment below!!
