DowJones 1000points Higher From Support, What Next?In this update we review the recent price action in the emini #DowJones futures contract and identify the next high probability trading opportunity and price objectives to target
YM1!

DOW JONES Small pull-back possible but bullish long-termOne and a half month ago we gave the most optimal buy entry for Dow Jones (DJI) exactly at the bottom of its 4-month Channel Down:
Right now the index is trading inside a shorter term Channel Up that is technically aiming at the 34900 Resistance, which is the December 13 2022 High, as part of its Higher Highs process. If however the 4H MACD currently completes a Bearish Cross, it is more likely to see one last pull-back below the 4H MA50 (blue trend-line) and near the 0.618 Fibonacci retracement level (33600) before the next rally.
-------------------------------------------------------------------------------
** Please LIKE 👍, FOLLOW ✅, SHARE 🙌 and COMMENT ✍ if you enjoy this idea! Also share your ideas and charts in the comments section below! **
-------------------------------------------------------------------------------
💸💸💸💸💸💸
👇 👇 👇 👇 👇 👇

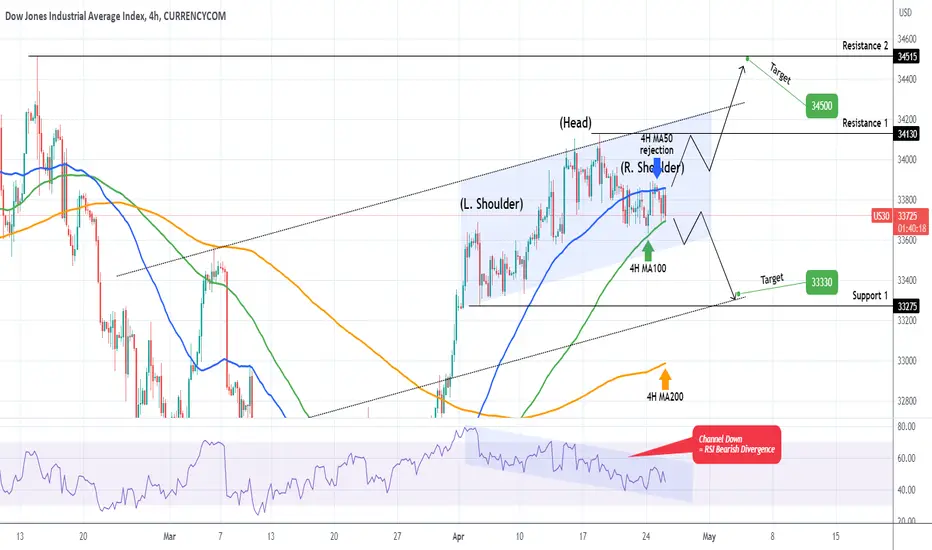
DOW JONES Potential Head & Shoulders and invalidation level.Almost a month ago we gave the most optimal buy entry for Dow Jones (DJI) exactly at the bottom of its 4-month Channel Down:
Right now, we see an emerging Head and Shoulders (H&S) pattern, which is a technical pattern typically formed on market tops. The key now is the 4H MA100 (green trend-line). A closing below it, will most likely accelerate the pull-back towards Support 1, in which case we will target 33330.
A 4H candle close above 4H MA50 (blue trend-line) will be a bullish break-out signal and should invalidate the H&S pattern, targeting first Resistance 1 and Resistance 2 in extension, in which case our Target will be 34500.
Note the the 4H RSI has been inside a Channel Down since April 04, thus a big Bearish Divergence when compared to the price's Channel Up.
-------------------------------------------------------------------------------
** Please LIKE 👍, FOLLOW ✅, SHARE 🙌 and COMMENT ✍ if you enjoy this idea! Also share your ideas and charts in the comments section below! **
-------------------------------------------------------------------------------
💸💸💸💸💸💸
👇 👇 👇 👇 👇 👇
DowJones H4 Actions Areas For The Week AheadIn this update we review the recent price action in the emini #DowJones futures contract and identify the next high probability trading opportunities and price objectives to target

YM1! US30USD DOW 2023 APR 24 WEEKYM1! US30USD DOW 2023 APR 24 WEEK
Discretionary trade at the 34275 rejection yielded 350pts.
With price failing to reach previous supply level 34605,
could market be indicating that demand at higher levels
have been exhausted?
If so, we may be looking at further distribution (i.e. selling)
Possible scenarios:
1) With weakness observed, wait to short at rejection at 34605 // 34275
2) Possibility of rotation between 33670 - 34275 = trade at boundary
of range
Volume Analysis:
Daily: Possibility of buying climax.
Price reaction levels
Short on Test and Reject | Long on Test and Accept
35228 34605 34275
33670 32681 31657
Remember to like and follow if you find this useful.
Have a profitable week ahead. CBOT_MINI:YM1!

DOW JONES: Two Channel Up patterns in progress.Dow Jones is mostly neutral on the 4H timeframe due to the slow price action of the past 10 days but remains bullish long term on the 1D timeframe (RSI = 64.809, MACD = 269.290, ADX = 67.751) as the Channel Up is intact following the Golden Cross.
In fact, if the 4H MA50 continues to support (has been doing so for almost 1 month since March 24th), we see the potential for a new Channel Up to emerge as shown by the dashed lines. This can take the price straight to R3 (TP = 35,800). If the 4H MA50 fails to hold, we will sell short term to the 1D MA50/4H MA200 range (TP = 33,200) and then buy for a less aggressive target on R1 and the top of the March Channel Up (TP = 34,600).
Prior idea:
## If you like our free content follow our profile to get more daily ideas. ##
## Comments and likes are greatly appreciated. ##

YM1! US30USD DOW 2023 APR 17 WEEKCBOT_MINI:YM1!
YM1! US30USD DOW 2023 APR 17 WEEK
Previous long scenario2 at 32595 // 33590 worked well.
Potential weakness observed.
Market now is approx. 500pts away from 34605.
Possible scenarios:
1) Trade to be guided by channel
2) With weakness observed, wait to short at channel's
supply line or rejection at 35228 // or 34605 previous
rejection area
Volume Analysis:
Weekly: higher volume up bar close off high
= minor weakness
Daily: Higher vol mark up to close lower, and a close below
middle of bar = potential weakness
Price reaction levels
Short on Test and Reject | Long on Test and Accept
35228 34605 33590
32595 31657
Remember to like and follow if you find this useful.
Have a profitable week ahead.

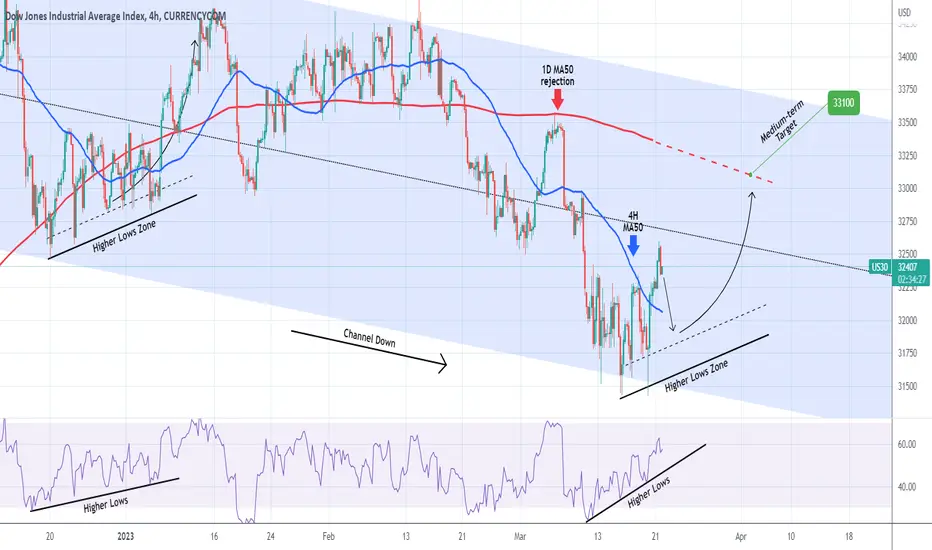
DOW JONES Pulling back for a lower buy opportunityDow Jones is pulling back to the 1day MA50, which is headed to the bottom of the Channel.
You can sell the distance but focus more on buying as close to 33100 as possible and this is the neckline of the Inverse Head and Shoulders pattern.
Target 34500 (Resistance Zone A).
Can be viewed as the inverted structure of December 15th - February 15th.
Previous chart:
Follow us, like the idea and leave a comment below!!

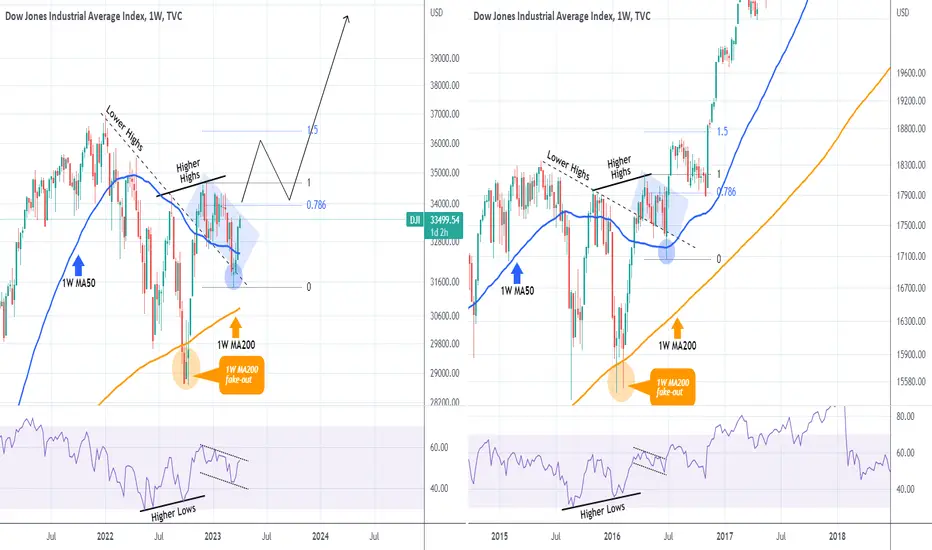
DOW JONES has started a rally that will amaze mostDow Jones is currently on the 3rd straight green 1W (weekly) candle above the 1W MA50 (blue trend-line), testing the top of the 4-month Channel Down. We have previously seen almost the same pattern during the 2015-2016 correction (E.U./ China/ Oil crisis). A fake-out below the 1W MA200 (orange trend-line) initiated a rebound above the correction's Lower Highs trend-line and formed a Channel Down.
This Channel Down in 2016 was nothing but a Bull Flag pattern which after another fake-out, this time below the 1W MA50, it rebounded and almost reached the 1.5 Fibonacci extension with a final pull-back on Fib 0.786 that kick-started a very aggressive rally. Even the 1W RSI patterns match. Do you think that's the blue-print for Dow?
-------------------------------------------------------------------------------
** Please LIKE 👍, FOLLOW ✅, SHARE 🙌 and COMMENT ✍ if you enjoy this idea! Also share your ideas and charts in the comments section below! **
-------------------------------------------------------------------------------
💸💸💸💸💸💸
👇 👇 👇 👇 👇 👇
What to watch in Q21. Any more bank failure?
Bank crisis stabilized after UBS takeover Credit Suisse and First Republic Bank had been injected deposit to restore confidence. We can’t rule out any bank failure in Q2, especially the collapse of Lehman Brother was after the rescue of Bear Stearns. Having said that, the material different between now and the global financial crisis is the asset quality, that the subprime loan is basically at default while the long-term treasury and MBS many banks are holding now can recoup the floating loss if they can be held until maturity. Situation will improve with time. The drop of treasury yield because of risk aversion is also a self-cure mechanism that reduce the floating loss, and lower depositor’s incentive to move money out from banking system. Therefore, the level of Treasure yield is an important factor to determine whether a bank run might occur again, since higher yield means bigger deposit outflow to seek better yield return and a bigger loss of bank asset. The resurge of yield will worsen the sentiment and dampen confidence. Another good indictor is the size of emergency funding facilitates that Fed is providing to banks. If there is a sudden increase on the size, this could imply there might be another bank in trouble.
2. How lending be impacted after the bank crisis?
Although Fed set the policy rate, it is the Bank to lend money in a rate they desire to the business and individual. In order to improve and avoid further deterioration of asset quality, Bank might take a more conversative approach in lending. The outflow of deposit also reduced Bank’s ability and willingness to lend. Since FDIC is asking Banks to pay the bill for saving SVC and Signature Bank, together with US government is seeking a tighter regulation for banking sector and many bank need to increase deposit rate to keep deposit, higher capital/operating cost might make Bank more selective and ask for higher lending rate to compensate the cost, that is not good for the whole economy.
3. Inflation trend?
Even OPEC+ surprised the market by cutting production that boost price, Energy should still strongly pressure headline inflation downward in Q2, especially on a YOY basis. NYMEX WTI crude oil above $100 most of the time in Q2 2022 and reached $123. Compare to current energy price, there will be an obvious negative impact in headline inflation. The delayed effect of lower property price and rent should also drive the inflation lower. We have seen some signs of lower service inflation, and if banking crisis harm business confidence, we might see a less tight employment market and a less wages growth. Despite OPEC+ action might make thing a little bit complicated, we might still see some decent drop in inflation in Q2.
4. Fed to end hiking cycle after May’s meeting?
May could be the last hike in this cycle. As mentioned, the inflation is cooling down and bank crisis will hurt the economy. Fed will also avoid hiking rate too much that will drive the Treasury yield up that might refuel the bank crisis. February Core PCE is trending lower, so as long as inflation doesn’t accelerate, a full stop of hiking cycle after May’s meeting will be a reasonable bet.
5. Recession possibility?
Inverted yield curve and ISM survey pointed to recession. Q2 could be the turning point of economy growth and we might see some slowdown. Recession has become base case scenario to many investors and they will allocate their asset and conduct trading strategy accordingly. If inflation under control and GDP growth, probably in Q3, recorded a deeper-than-expected negative growth, Fed might start easing by the end of this year.
6. End of War?
Russia-Ukraine war could enter the decisive phase in Q2 when Ukraine could launch the counter attack in Spring. It is very hard to predict the outcome but assuming Russia lost the war, the geopolitical ecosystem might be rewritten as well as the regime. How ally of Russia react is also highly unpredictable.
With interest rate hike cycle coming to the end, there might be more rooms for Treasury yield to go lower. This will benefit growth stock so Nasdaq might outperform Dow again, adding to the gap built in Q1. Recession fears is not friendly to most of the commodities (except gold), and any big change on War might mean a lot to many cyclical commodities such as oil, natural gas, nickel and more.
Good Luck and Good Trading in Q2.
Disclaimers
Above information are for illustration only and there is no guarantee on the accuracy of the information. They should not be treated as investment recommendations or advices.
CME Real-time Market Data help identify trade set-ups and express my market views. If you have futures in your trading portfolio, check out on CME Group data plans in TradingView that suit your trading needs www.tradingview.com gopro/

DowJones H1 As 33500 Supports Target A Pivotal 34000 Test NextIn this update we review the recent price action in the emini #DowJones futures contract and identify the next high probability trading opportunity and price objectives to target

DOW JONES above the 1D MA50 for the first time in monthDow Jones hit (and closed over) the 1D MA50 on Friday for the first time in more than a month (Feb 20th last closing over it). With 1D technicals on very healthy bullish levels (RSI = 60.420, MACD = 12.500, ADX = 35.536) this is a very positive sign on the long-term. Especially since the RSI crossed over the 4 month LH trendline.
Our TP (33,450) from our trade idea 2 weeks ago (see below) is almost hit, however short term traders need to start and consider the immediate Reistance levels that the index needs to break in order to extend the long term rally. This is firstly the 33,550 High of March 6th and secondly the top of the December Channel Down pattern. A 1D closing above each would be a bullish continuation signal that would target the next level of Resistance. Primarily we look for a closing above the Channel Down in order to target R1 (TP = 34,350). Conversly a rejection and closing under the 33,550 Resistance would target the lower Symmetrical Support (TP = 32,600).
Prior idea:
## If you like our free content follow our profile to get more daily ideas. ##
## Comments and likes are greatly appreciated. ##

YM1! US30USD DOW 2023 APR 03 WEEK
YM1! US30USD DOW 2023 APR 03 WEEK
Price was marked up on low volume =
possibility of trapping longs. Keep your stops tight
if you are holding long positions.
Possible scenarios:
1) Sell if False break of 33590, test and reject of
recent high
2) Long on test and accept of 32595 // 33590
Volume Analysis:
Weekly: Low vol up bar close off high =
possible selling, trapping longs
Daily: Wide spread low vol up bar close off high
= possible selling, trapping longs
Price reaction levels
Short on Test and Reject | Long on Test and Accept
35228 34605 33590
32595 31657
Remember to like and follow if you find this useful.
Have a profitable week ahead.

DOW JONES almost on our target. What's next?Two weeks ago, we gave the most optimal buy entry for Dow Jones (DJI) exactly at the bottom of its 4-month Channel Down:
The price has almost hit our 33100 Target and we think it is time to look into the longer term. We made a case on the idea above that Dow is currently repeating the October - November rally, as the RSI pattern is identical. In addition, that larger pattern could be an Inverse Head and Shoulders, which is a bullish reversal formation, in fact it may be characterized as the bottom formation of the 2022 Bear Phase.
As a result the target can be as high as the Shoulders Resistance, the Higher Highs trend-line. If it is inversely symmetrical to June, we can expect a +12.78% rise. This gives us a target for the next 4-6 weeks at 35400.
-------------------------------------------------------------------------------
** Please LIKE 👍, FOLLOW ✅, SHARE 🙌 and COMMENT ✍ if you enjoy this idea! Also share your ideas and charts in the comments section below! **
-------------------------------------------------------------------------------
💸💸💸💸💸💸
👇 👇 👇 👇 👇 👇

Sell setupTrade: Sell at 32975 or higher
Stop: 33150
Notes
The model:
The Ingenuity Trading Model is a Geometric Markov Model with specific inputs related to Price, Time, Volume , and Volatility. The model attempts to predict local minimums and maximums in price on a daily and weekly basis. A fancy way of saying a trading system that detects specific patterns in price, time, volume, and volatility and indicates whether to buy or sell.
On winning trades after 1 day take at least ⅓ of the position off and move stop to breakeven

DOW JONES: Ranged until it breaks the 4H MA200 and turns bullishDow Jones remains neutral on the 1D technicals (RSI = 47.239, MACD = -227.510, ADX = 31.577) as the price has been mostly ranging for 2 weeks between the 32,600 Symmetrical Resistance and 31,800 Symmetrical Support.
Todays rejection should give one more pull back to the Symmetrical Support if the 4H MA50 breaks. On the other hand, a full 4H candle closing over the Symmetrical Resistance, will most likely cross over the 4H MA200 too and target long term P1 at 33,450.
Prior idea:
## If you like our free content follow our profile to get more daily ideas. ##
## Comments and likes are greatly appreciated. ##

DowJones H1 To Test Triangle ResistanceIN this update we review the recent price action in the emini #DowJones futures contract and identify the next high probability trading pattern and price objectives to target

YM1! US30USD DOW 2023 Mar 27
YM1! US30USD DOW 2023 Mar 27
Support long at 31747 was good.
Note the trendline resistance at the moment.
I'll be back in April, keep profits and rest from cold.
Possible scenarios:
1) Short on reject of 32789
Volume Analysis:
Weekly: Ave vol up bar close off high (some supply present)
Daily: Ave vol up bar close toward high
Price reaction levels
Short on Test and Reject | Long on Test and Accept
34689 32789
30513 28635
Remember to like and follow if you find this useful.
Have a profitable week ahead.

DowJones Set Up To For A Third Test Of Monthly Range SupportIn this update we review the recent price action in the emini DowJones futures contract and identify the next high probability trading opportunities and price objectives to target

Dow Jones (YM1!)- fuel up in this week and start droping in JulyDow Jones (YM1!)- fuel up in this week and the entry point is the box. After reaching to the above targets and if a reversal candle shows up. Be careful!

DOW JONES has started the new bullish wave.This is basically to last week's buy signal at the bottom:
As you see Dow Jones (DJI) made a new Lower Low (bottom) on the 4-month Channel Down and broke above the 4H MA50 (blue trend-line) again. The move is supported by a Higher Lows Zone (as is the RSI), similar to the previous Channel Down Low in late December. With the Fed Rate Decision tomorrow always unleashing volatility, we can see one last pull-back and then rebound towards the 1D MA50 (red trend-line) and our 33100 Target.
-------------------------------------------------------------------------------
** Please LIKE 👍, FOLLOW ✅, SHARE 🙌 and COMMENT ✍ if you enjoy this idea! Also share your ideas and charts in the comments section below! **
-------------------------------------------------------------------------------
💸💸💸💸💸💸
👇 👇 👇 👇 👇 👇
DOW JONES Huge Inverse Head and Shoulders aiming at the 2022 HigDow Jones/ US30 is rebounding after approaching the 1week MA200. This is a major Support that held on June 2022.
That low can be viewed as the Left Shoulder of a giant Inverse Head and Shoulders pattern and the current low as its Right Shoulder.
Target the bottom of Support Zone A at 35350.
Follow us, like the idea and leave a comment below!!

DowJones Actions Areas For The Weeke AheadIn this update we review the recent price action in the emini DowJones futures contraction and identify high probability action areas for the trading week ahead
