YM1! US30USD DOW 2022 OCT 03
US30USD YM1! DOW 2022 OCT 03
Dow Scenario2 breakdown yielded 700pts for last week.
congrats to those who shorted.
Possible scenarios:
1) Short on rejection of trendline // 29639 // 28886
2) Prepare to long if round bottom is observed and market
retraces during an upward move and finds support.
3) Market rotates, then find trades at edge of rotation zone.
(Yellow box)
Price reaction levels
Short on Test and Reject | Long on Test and Accept
32789 31793 31385
31042 30636 30202
29639 29315
Weekly: Higher vol & narrower spread down bar, close off low
= minor demand
(ave vol on bar itself) = demand coming in
Daily: Ave vol down bar close off low = No Supply
H4: Vol showed buying on the downtrend. Coupled with possible
SPRING setup
Remember to like and follow if you find this useful.
Have a profitable week ahead.
YM1!

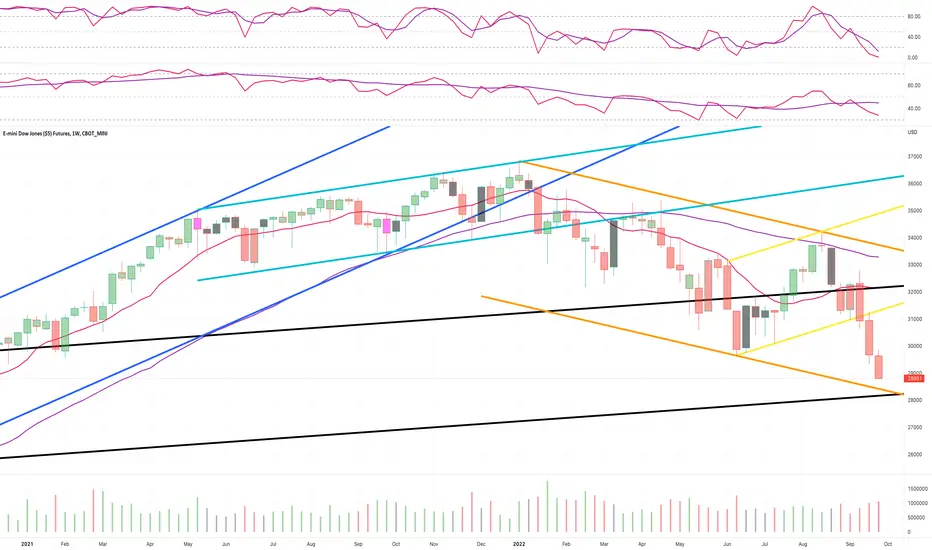
YM1! - Weekly Market Update, 10/3Dow futures settled below the June lows this week and are likely headed for the lower $28,XXX handle in the coming week(s).
Potentially breaking down from there would accelerate a plunge towards the 2020 lows in the coming month(s).

YM1! DAY TRADIN STRATEGYHow can we use simple indicators to trade??
I Use 1 minute Chart of Mini dow futures contract
the add #supertrade indicator
SIGN UP FOR ZOOM in REAL TIME
7:00 AM EST TIME
$spx $ES_F $DJIA $DJ_F $COMPQ $QQQ $SPY

DOW JONES PLANdear traders dow jones has exploded lately so i expect market will retest this area i axpect to buy dow jones at 28930 the target will be 29122 always wait for the best entry good luck

DOW JONES Oversold but that alone not enough for a buy------------------------------------------------------------------------------------------
** Please LIKE 👍, SUBSCRIBE ✅, SHARE 🙌 and COMMENT ✍ if you enjoy this idea! Also share your ideas and charts in the comments section below! This is best way to keep it relevant, support me, keep the content here free and allow the idea to reach as many people as possible. **
------------------------------------------------------------------------------------------
The Dow Jones Industrial Average (DJI)broke and closed last week below its 1W MA200 (red trend-line), for the first time since the week of May 11 2020, a very bearish sign on its own. Based on what the index did on May 09 2022 after breaking the previou Support (Double Bottom), the price now targets the -0.236 and -0.5 Fibonacci extensions on the medium-term.
Being however oversold with the 1D RSI hitting 24.85 yesterday for the first time since the COVID crash (March 12 2020), there is an equal probability of a short-term rebound or even a medium-term one if this is a temporary bottom like June 17. With signals on the higher and lower time-frames being mixed, the oversold RSI state isn't enough on its own to take the buy. It would be best to do so after a confirmation pattern.
The two strongest confirmation signals at the moment are:
1) When the 1D MACD makes a Bullish Cross, which since December 07 2021 always delivered a short-term rally.
2) A closing above the 0.618 Fibonacci level (now at 31357).
If you take those buys, you will have some ground behind them. Otherwise the are within the 0.618 and yesterday's lows gives a mixed sentiment. Below yesterday's lows, most likely we will see further strong selling, initially targeting the -0.236, as mentioned, at 28230.
------------------------------------------------------------------------------------------
You may also TELL ME 🙋♀️🙋♂️ in the comments section which symbol you want me to analyze next and on which time-frame. The one with the most posts will be published tomorrow! 👏🎁
------------------------------------------------------------------------------------------
👇 👇 👇 👇 👇 👇
👇 👇 👇 👇 👇 👇
👇 👇 👇 👇 👇 👇

US30USD YM1! DOW 2022 SEP 25 Week
US30USD YM1! DOW 2022 SEP 25 Week
Dow gave out presents last week with a good short opportunity.
Broadening downward wedge = demand returning.
Watch 29639 = CRITICAL SUPPORT.
Possible scenarios:
1) Long if 29639 / lower trend line support holds
2) Short if price breaks down 29639 on high volume and returns
to test on lower volume.
3) Short on rejection of upper trend line // 30636
4) Bullish break out of wedge: Long on test and accept of breakout
Price reaction levels
Short on Test and Reject | Long on Test and Accept
32789 31793 31385
31042 30636 30202
29639 29315
Weekly: Higher vol & narrower spread down bar, close off low
= minor demand
(ave vol on bar itself) = demand coming in
Daily: Ave vol down bar close off low = No Supply
H4: Vol showed buying on the downtrend. Coupled with possible
SPRING setup
Remember to like and follow if you find this useful.
Have a profitable week ahead.

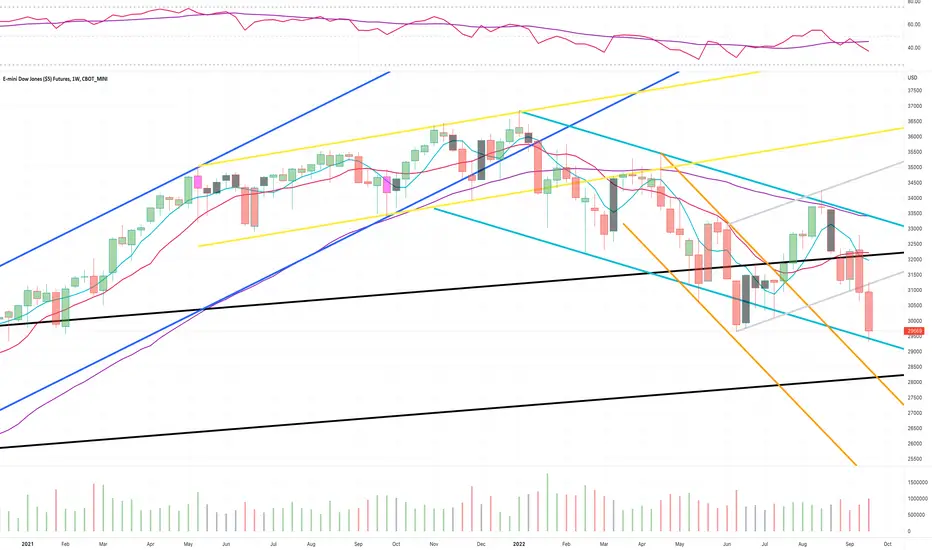
YM1! - Weekly Market Update, 9/26Dow futures finding support at indicated TEAL channel structure below and essentially settled this week double bottoming off of the June 2022 low place earlier this year. The overall market has likely oversold itself these past several weeks, some relief could be anticipated however it appears the bears might be here to stay for a while...
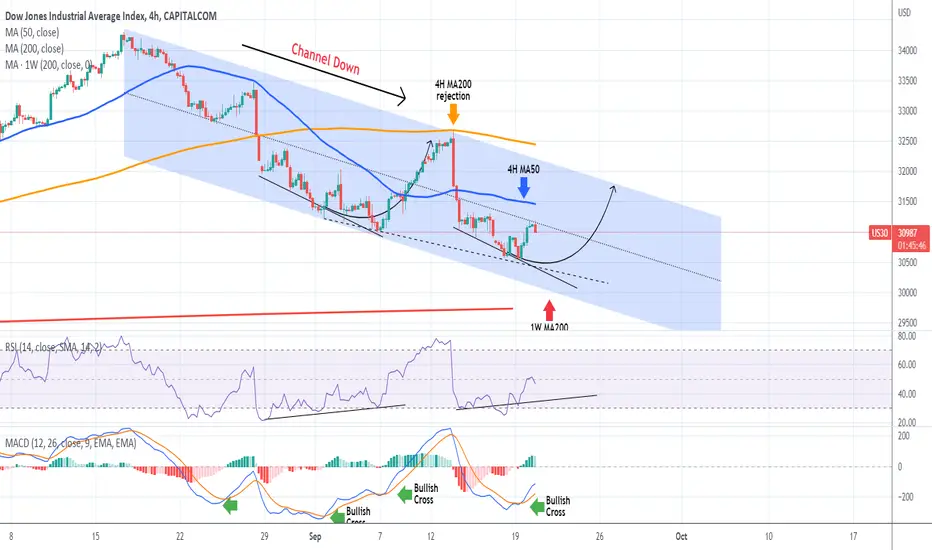
DOW JONES The dominant short-term Channel. What it shows next.The Dow Jones Industrial Average (DJI) is currently pulling-back as yesterday's rebound has failed so far to break the Channel's median. That is the Channel Down, the dominant pattern, that the index has been trading in since the August 16 High. As you see that middle trend-line has been holding a key role within this pattern.
The current price action resembles the accumulation mini phase of September 02 - 07, where the price was supported on a Lower Lows line that eventually pushed it above the 4H MA50 (blue trend-line) and the Channel's middle, to rise to the top of the Channel, eventually getting rejected on the 4H MA200 (orange trend-line).
With the 4H MACD on a Bullish Cross, we are expecting Dow to reach 31700 and make a new Lower High within the Channel Down within a 1 week horizon.
--------------------------------------------------------------------------------------------------------
** Please support this idea with your likes and comments, it is the best way to keep it relevant and support me. **
--------------------------------------------------------------------------------------------------------
Dow Jones 30600 Make Or BreakIn this update we review the recent price action in the DowJones emini futures contract and identify the next high probability trading opportunity and price objectives to target

US30USD YM1! DOW 2022 SEP 19 Week
US30USD YM1! DOW 2022 SEP 19 Week
After trapping longs, market declined aggressively. Temporary
demand on average volume has returned, which could be a way of
absorbing any long positions still present in the market.
Possible scenarios:
1) Long if 30406 / 30636 is supported
2) Short on rejection of 31385 / 31042 / trend channel rejection
Price reaction levels
Short on Test and Reject | Long on Test and Accept
32789 31793 31385
31042 30636 30406
Weekly: Higher vol & wider spread than previous bar, close off low
(ave vol on bar itself) = demand coming in
Daily: Ave vol down bar close toward high = Demand overcoming supply
H3: Ultra high vol bar + ave vol up bars = Demand has returned
Remember to like and follow if you find this useful.
Have a profitable week ahead.

YM1! - Weekly Market Update, 9/19All major market indices for this past week have exhibited weakness.
However, none of the futures markets offered a 1%+ settlement confirmation.
Could this be an aggressive retest of the ascending support structure? Possibly.
Could this be setting the stage for a double bottom or even the next leg down? Possibly.
While the bias remains short, the index settlement lack the confirmation I need.

E-MINI DOW JONES ($5) FUTURESA strong requirement has been achieved and a very strong support has been broken. Our goal will be pro support, which is considered strong

DOW JONES invalidating bearish patterns, targeting 34000 again.The Dow Jones Index (DJI) closed yesterday above its 1D MA50 (blue trend-line) as it is extending the rebound we called on our previous analysis:
As you see, that rebound came exactly on the Higher Lows trend-line that started on the June 17 Low and was the second (July 14 the first) time it held, making it the short-term Support. What Dow achieved with that 1D candle close above the 1D MA50, is to invalidate the February 24 - April 28 2022 fractal, which by that time was similar but failed to break and close above its 1D MA50 and eventually got sold aggressively.
What makes the current rebound potentially having a long-term effect is 1) the 1D RSI rebound on its multi-year Oversold Zone and 2) the Bullish Cross on the 1D MACD, which within 2022 always delivers at least a +8% rebound. Such % rise would be the test of the 1D MA200 (orange trend-line), which is our medium-term target. As mentioned numerous times before, in order to commit to long-term buying we would like to see the index close above the 1D MA300 (yellow trend-line) first, which provided the rejection on the August 16 High.
So far the medium-term trading strategy is to buy every pull-back on the Higher Lows trend-line/ RSI oversold zone. A break below that level, we'll consider a bearish signal, targeting the 1W MA200 (red trend-line).
--------------------------------------------------------------------------------------------------------
** Please support this idea with your likes and comments, it is the best way to keep it relevant and support me. **
--------------------------------------------------------------------------------------------------------

US30USD YM1! DOW 2022 SEP 12 Week
US30USD YM1! DOW 2022 SEP 12 Week
Last week's Scenario1 long on support of dotted trend line was good.
Caution: long trap observed, do not chase long.
Possible scenarios:
1) Long if 31450 / 31864-32029 is supported
2) Short on rejection of solid trend line / 32546
3) if triangle formation observed there may be short opportunity
Price reaction levels
Short on Test and Reject | Long on Test and Accept
32546 32029 31864
31450 30975 30406
Weekly: Low vol up bar close off high = minor weakness
Daily: Low vol up bar close off high = weakness
H4: Low vol narrow up bars + narrow close, followed by
ave vol up bar + UT bar = weakness
Remember to like and follow if you find this useful.
Have a profitable week ahead.

DOW JONES hit the Higher Lows line. 1D RSI oversold.The Dow Jones Index (DJI) is on its 7th straight day below the 1D MA50 (blue trend-line) having fallen almost -10% since its August 16 High caused by the strong rejection on the 1D MA300 (yellow trend-line). The price has hit today the Higher Lows trend-line that started on the June 17 Low and had one more contact on July 14.
This is the only Support level that stands before a potential June 17 Low re-test, which is also where the 1W MA200 (red trend-line) is currently at, the index' natural long-term technical Support. As long as the Higher Lows hold, we can expect sideways trading within that trend-line and the 1D MA50. If the latter breaks, consider it a buy break-out signal targeting the 1D MA300 again or at least the 1D MA200 (orange trend-line) which was hit both on the June-Aug and Feb-March rallies. If the June Low and 1W MA200 break, then we can expect a new Lower Low around the -0.236 Fibonacci extension, as the May 20 Low did.
On a short to medium-term perspective, this is a buy opportunity as the 1D RSI is touching the Oversold zone that has been holding since the 2020 COVID crash. As you see, every direct hit in the Zone has delivered a rebound of at least +8.00%.
--------------------------------------------------------------------------------------------------------
** Please support this idea with your likes and comments, it is the best way to keep it relevant and support me. **
--------------------------------------------------------------------------------------------------------

US30USD YM1! DOW 2022 SEP 05 Week
US30USD YM1! DOW 2022 SEP 05 Week
Last week's short on retracement/channel rejection was good.
Temporary support at the moment at 31221.
Possible scenarios:
1) Long at 31221 / dotted trend line support
2) Short on rejection of solid trend line / 32029 / 31221 /
retracement on low
volume
Price reaction levels
Short on Test and Reject | Long on Test and Accept
32546 32029 31221
30406 29639
Weekly: Higher vol than previous bar, narrower spread,
close off low = demand coming in
Daily: Ave vol down bar close off low = minor demand
H4: Ultra high vol bar + up bar close of low = minior demand
Remember to like and follow if you find this useful.
Have a profitable week ahead.

YM1! - Weekly Market Update, 9/5Major market indices have all settled BELOW their 50 day moving averages.
I believe the coming weeks are going to be telling for the broader market(s).
Either we regain some traction and take out the recent highs OR we break the recent lows and leg down even further.

DOW JONES on the 2008 crash fractal and how it avoids it. I've made many comparisons of Dow Jones' (DJI) 2022 Bearish Price Action with past Bear Cycles but being near closing its 3rd straight red 1W (weekly) candle since the August 15 rejection on the 1W MA50 (blue trend-line), it is time to update it.
As you see, this is a comparison of Dow's 2021/2022 chart against 2007/2008. The dynamic factor is WTI Oil (black trend-line). As you see in July 2008 Oil peaked while the index had already started it's correction inside the new Bear Market. Dow's 1W MA50 rejection was followed by a sharp sell-off below the 1W MA200 (orange trend-line) where the 1W MA50 crossed below the 1W MA100 (green trend-line) to form a Bearish Cross. The time that the index reached the 1W MA200 from its Market Top was 37 weeks (259 days).
At the moment the 2022 fractal looks to be following closely the 2008 sequence. If we exclude the fundamental extreme of the peak of the Ukraine - Russia war when Oil registered its peak (March 2022), its technical normalized top was in June 2022 right when Dow rebounded just before hitting the 1W MA200. See how even the 1W RSI sequences are identical so far. What this indicates is that Oil can continue dropping as the Fed attempts to lower an out of control inflation, but still stocks can fall along with it, just like it happened from mid 2008 to early 2009.
As a result, the 1W MA50 rejection seems so far consistent with mid-phases of a Bear Cycle. Fundamentally, a big factor that is not consistent with the 2008 fractal is the strong labor market we're currently at, with the Unemployment Rate (teal trend-line) still on market lows as opposed to the 2008 fractal, which by the 1W MA50 rejection in May 2008, it was already rising aggressively. This means that technically, a weekly candle close above the 1W MA50 can be regarded as an invalidation of the Bear Cycle fractal. Also the 1W RSI printing Higher Highs can be taken as such.
What do you think will happen next? Can Dow close above the 1W MA50 or August's rejection will hit the 1W MA200 as per the 2008 fractal?
P.S. Because the chart has the added elements of WTI Oil and the Unemployment Rate plotted and pinned to scales B and Z, it is not constant and may appear distorted based on your screen's/ browser dimensions. The original looks like this below, so if yours doesn't, adjust the vertical/ horizontal axis in order to make it look like this and better understand what is illustrated:
--------------------------------------------------------------------------------------------------------
** Please support this idea with your likes and comments, it is the best way to keep it relevant and support me. **
--------------------------------------------------------------------------------------------------------

DOW daily : upper fibo 61% is 1st target but it can go to 35300butterfly pattern (and stupid Biden+Powel) do its job well push markets down
now dow reach fibo 61% (see red fibo on chart ) and it can start +uptrend to 33070
when pinbar comes on 1hour or 4hour or daily chart dont fear pick low size buy and hold it 7-8 day SL:pinbar low
good luck

E-MINI DOW JONES ($5) FUTURESVery strong landing and with the break of a very excellent support area and there is a great likelihood that he will continue landing

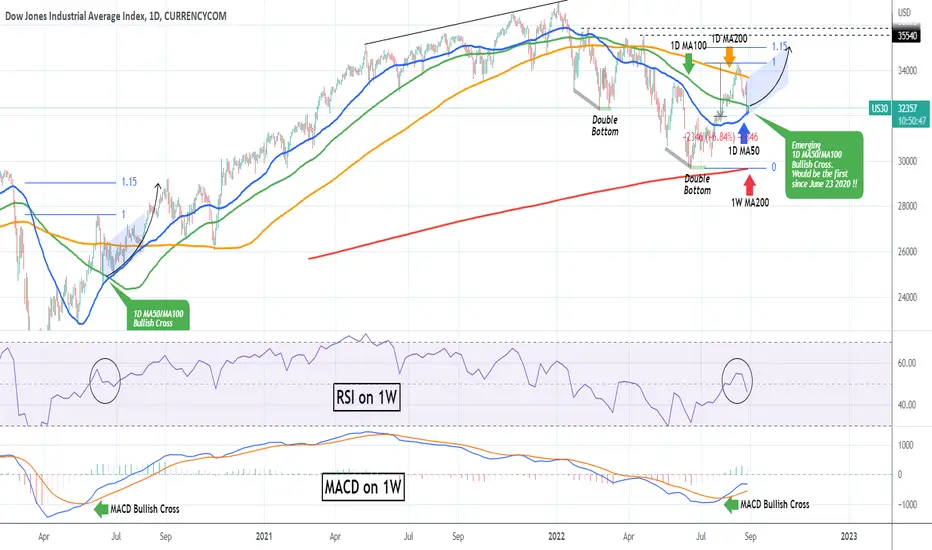
DOW JONES holding the 1D MA50 in a repeat of the COVID recovery!The Dow Jones Index (DJI) hit the 1D MA50 (blue trend-line) yesterday and today shows the first signs of recovery. The drop from the August 16 High has been substantial, almost -7% but so has the rise since the June 17 low (more than +15%), so profit taking was natural, especially since the High exceeded the 1D MA200 (orange trend-line). The first Resistance on the short-term is the 1D MA100 (green trend-line) which is being tested at the moment.
On the long-term though, this pull-back to the 1D MA50 after such a strong rally, resembles the initial recovery of March - June 2020 from the COVID crash. Especially considering also that the RSI and MACD on the 1W time-frame have been printing identical patterns, with the MACD being on a Bullish Cross since July 27 as it did on May 22 2020!
From June 15 2020 to July 21 2020, the 1D MA50 held as Support four times and it catapulted Dow to the 1.15 Fibonacci extension. A repeat of that pattern sets the current medium-term target exactly on the 35000 level. Notice also that as on June 23 2020, Dow is currently close to having the 1D MA50 cross above the 1D MA100, which is a Bullish Cross formation and that would be the first time since then!
--------------------------------------------------------------------------------------------------------
** Please support this idea with your likes and comments, it is the best way to keep it relevant and support me. **
--------------------------------------------------------------------------------------------------------
US30USD YM1! DOW 2022 AUG 29 Week
US30USD YM1! DOW 2022 AUG 29 Week
Last week's 33205 rejection provided short opportunity.
Possible scenarios:
1) Long at 31780 support
2) Short on rejection of 32546 / 31780 / retracement on low
volume
Price reaction levels
Short on Test and Reject | Long on Test and Accept
34027 33326 32546
31780 31780
Weekly: Ave vol down bar close off low = Supply + some demand
Daily: High vol down bar close toward low = Supply, +
some demand coming in
H4: Climatic + high vol down bar close at low,
breaking down a previous support = bearish absorption
Remember to like and follow if you find this useful.
Have a profitable week ahead.
