DowJones Wave Trading Long & Short Set UpsIn this update we review the recent price action in the emini DowJones futures contract and identify the next high probability trading opportunity and price objectives to target
YM1!

DOW JONES rejection finding Support soon.Exactly 2 weeks ago on our last Dow Jones (DJI) analysis we stated that the price had entered a possible rejection zone (red) and unless it closed a weekly (1W) candle above the 1D MA200, we would get a pull-back:
Well as it turned out the index closed last week below both the 1D MA200 (red trend-line) and the 1W MA50 (blue trend-line), which are very close to each other, and got a considerable rejection this week. The price is now approaching the critical Support cluster that consists of the 1D MA100 (green trend-line) and the 1D MA50 (yellow trend-line). The chances of getting a new bounce are high as not only are wee on a 1W MACD Bullish Cross since late July but also the 1D MA50 is about to cross above the 1D MA100, forming a Bullish Cross. Last time that happened was on after the June 15 2020 1W candle, which was the first recovery from the March 2020 COVID crash:
As you see, the 1D MA50 and 1D MA100 held as Support levels and Dow was able to sustain a solid rise. Technically there is no reason not to expect a similar development but in order to technically claim that the index is back onto the long-term bullish trend we need to see a weekly candle closing above the 1D MA200.
--------------------------------------------------------------------------------------------------------
** Please support this idea with your likes and comments, it is the best way to keep it relevant and support me. **
--------------------------------------------------------------------------------------------------------
DowJone Tracking A Potential Wave 4 SequenceIn this update we review the recent price action in the emini DowJones futures contract and identify the next high probability trading pattern and price objectives to target

US30USD YM1! DOW 2022 AUG 22 Week
US30USD YM1! DOW 2022 AUG 22 Week
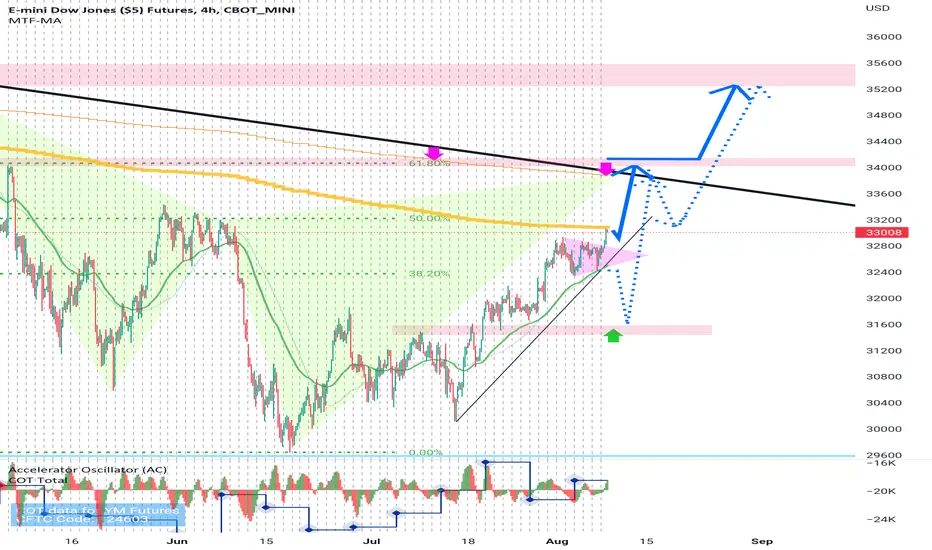
Last week supply returned for Scenario2 short opportunity.
Possible scenarios:
1) Daily/Weekly analysis showed minor strength,
let's see if demand is able to overcome supply for uptrend
continuation.
2) Short on rejection of 34027 or market
retraced on low volume.
Price reaction levels
Short on Test and Reject | Long on Test and Accept
34807 34027 33205
Weekly: Ave vol down bar close off low = minor strength
Daily: Ave vol down bar close off low = minor strength
H4: Very high volume up bar close off high followed by
down bar = weakness
Remember to like and follow if you find this useful.
Have a profitable week ahead.

DOW JONES rejected on the Golden Ratio. What's next?The Dow Jones index (DJI) broke above its 1D MA200 (orange trend-line) early this week but got rejected on the 0.618 Fibonacci retracement level (from its January 05 All Time High (ATH)). Failing to hold the 1D MA200 as a Support, can result into a short-term pull-back to test the lower Fibonacci levels (0.5 and 0.382) as well as the 1D MA100 (green trend-line) and 1D MA50 (blue trend-line) as Support.
This short-term technical correction, shouldn't change the long-term trend-line, which after the huge 1W RSI bounce and the +15% rally since the June 17 low, has turned bullish. Even fundamentally, this market rally was supported by the first significant retrace on the Inflation Rate (black trend-line) and coincided exactly with the top on the US10Y (teal trend-line). So as you see, the rally had strong fundamental drivers, especially the US10Y, whose late sustainable rise since August 01, seems to worry the stock markets. A new peak there, can mark the new low on Dow.
Also, notice that all prior 1D MA200 break-outs since February 01, failed to create a sustainable continuation and if we connect those tops with two trend-lines, we can see the solid technical Resistance that Dow Jones needs to overcome in order to be able to post a sustainable bullish trend long-term into the new Bull Cycle.
P.S. Because the chart has the added elements of the US10Y and Inflation Rate plotted and are not constant, it may appear distorted based on your screen's/ browser dimensions. The original looks like this below, so if yours doesn't, adjust the vertical/ horizontal axis in order to make it look like this and better understand what is illustrated:
--------------------------------------------------------------------------------------------------------
** Please support this idea with your likes and comments, it is the best way to keep it relevant and support me. **
--------------------------------------------------------------------------------------------------------

DowJones Momentum Divergence To Be AddressedIn this update we review the recent price action in the DowJones emini futures contract and identify the next high probability trading patterns and price objectives to target

For all traders in this market, especially buyers, For all traders in this market, especially buyers, the ban in the coming days, where a group of indicators indicating the price decline will meet, as the price rebounded on the resistance twice and a reversal candle was formed in addition to fading and equal to the last two columns of the (MACD) indicator
(YM)

US30USD YM1! DOW 2022 AUG 15 Week
US30USD YM1! DOW 2022 AUG 15 Week
Last week market reached previous supply zone.
Long on retracement continues still preferred
Possible scenarios:
1) Continue of upward momentum for long on retracement
2) Short on rejection at channel supply
Price reaction levels
Short on Test and Reject | Long on Test and Accept
34807 34027 33205
Weekly: Ave vol up bar = minor strength
Daily: Ave vol up bar = minor strength
H4: Ave vol up bar = minor strength.
Remember to like and follow if you find this useful.
Have a profitable week ahead.

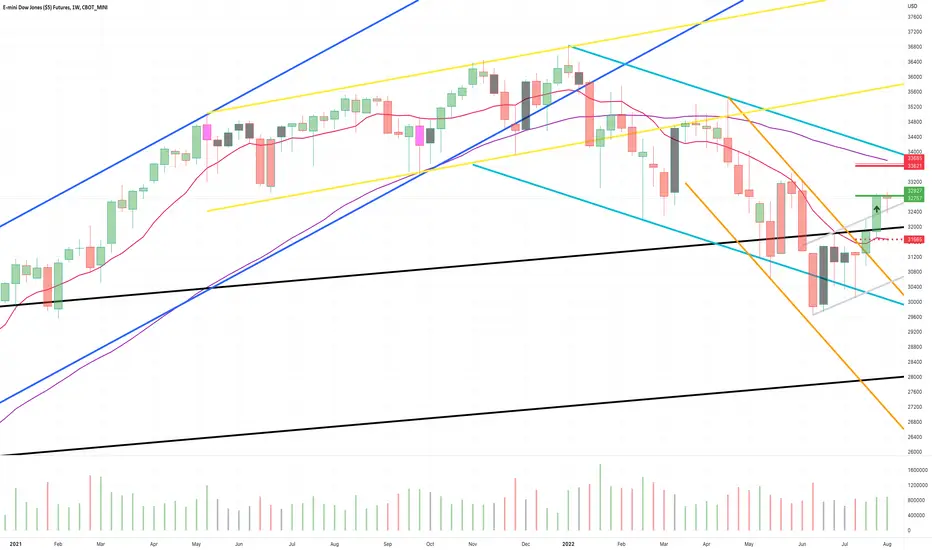
YM1! - Weekly Market Update, 8/15DJIA Futures have hit our projected bullish target.
Price is approaching the initial down trend structure formation and the 200 day SMA.
Two key things that need to be overcome in order for this market to grind higher.

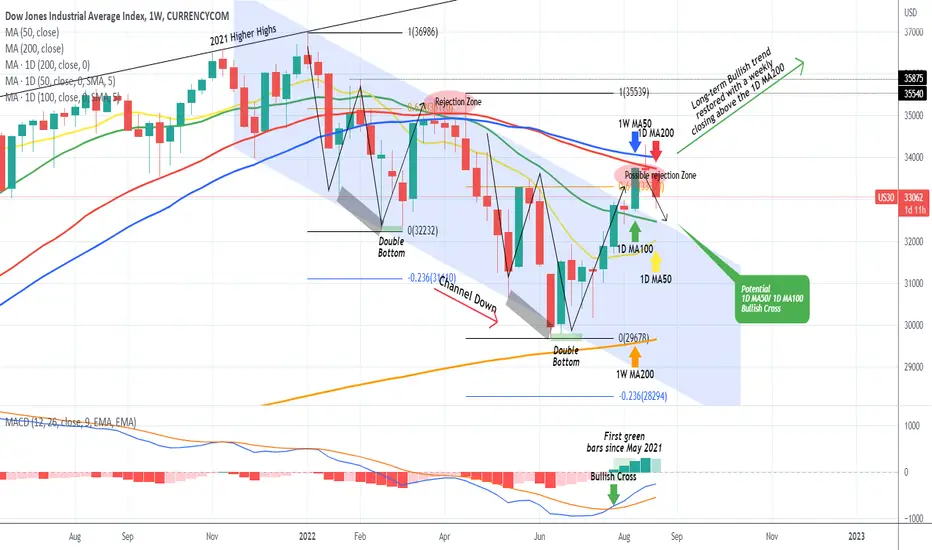
DOW JONES entered the rejection zone. Long-term trend decider!The Dow Jones Index (DJI) has finally entered the Rejection Zone that we wrote about last week, consisting of the 1D MA200 (orange trend-line) and the 0.618 Fibonacci retracement level:
With the RSI on the 1W time-frame at its highest level since January 17 2022 but more importantly the 1W MACD on the first Bullish Cross since this 8 month Bear Phase started, it is very likely that we've finally reached the point were the long-term trend shifts from bearish to bullish. However only a weekly closing above the 1D MA200 can confirm that. Until then, being so close to it offers a great Risk/ Reward trade using the tight SL approach just above it to limit the risk and target the 1D MA50 (blue trend-line).
A 1W close above the 1D MA200 should be enough to target the 35540 - 35875 Resistance Zone on the short-term. Important note that may go under the radar: the 1W MACD histogram posted in August its first green bars since May 2021, more than a year ago.
--------------------------------------------------------------------------------------------------------
Please like, subscribe and share your ideas and charts with the community!
--------------------------------------------------------------------------------------------------------

Dow 4 hour = fibo 61% show dow going to 34000exclent NFT news on friday , will push dow up this week !!!
if you have old sell , in deep hedge them and wait (never close buys frist)
strongly advice looking for buy , dont pick sell (only under red arrow +pinbar comes SL=pinbar high)
in 35200 we have powerfull support too , dow will see it too
i wish you win , stand on very very low and fix size
YM1! - Weekly Market Update, 8/8/22Dow Futures post a countertrend BUY signal ... Ideal entry, stop and target imaged on the chart.
Support and Resistance structures have been adjusted accordingly for your reference.
Wishing you a blessed and profitable week ahead.
DOW JONES close to a rejection zone. Bullish if it breaks.The Dow Jones Industrial Average (DJI) fulfilled our buy signal given in late June after the price made a Lower Low on its long-term Channel Down:
Right now the scene has slightly changed as the 1D RSI broke above its 8 month Resistance Zone and even though the price is now exactly on the Lower Highs (top) trend-line of the Channel Down, this may be the first sign that the trend is about to change from long-term bearish to bullish.
There is still a chance to break above the Channel Down without breaking the bearish trend as the 0.618 Fibonacci retracement level and the 1D MA200 (orange trend-line) are above it. Those are the levels where Dow got rejected last time (April 21) and started a downtrend to a new Lower Low on the -0.236 Fibonacci extension.
As a result a plan that offers excellent R/R opportunities is to sell just above the 0.618 Fib (see rejection zone) with a tight SL on the 1D MA200. Short-term target the 1D MA50 (blue trend-line), where you can short if it breaks before hitting 0.618. Medium-term target 30450. If we get that candle close above the 1D MA200 then its minimum loss on the SL and switch to a break-out buy on the long-term. In that case the short-term targets can be the previous Lower Highs (33540 and 35875).
--------------------------------------------------------------------------------------------------------
Please like, subscribe and share your ideas and charts with the community!
--------------------------------------------------------------------------------------------------------

Dow 4 hour = upper target is 34000above green arrow we can pick buy (after pinbar comes on 1hour or 4hour or daily chart with SL = 100 point TP=33800 (under trend line)
ADVICE = DONT PICK SELL , LOOKING FOR BUY IN DEEP WITH SL IN DAY LOW OR 100 POINT
good luck

DowJones Two Way Trading Opportunities In this update we review the recent price action in the DowJones futures contract and identify the next high probability trading opportunities and price objectives to target

US30USD YM1! DOW 2022 AUG 01 Week
US30USD YM1! DOW 2022 AUG 01 Week
Last week market reached previous supply zone. Long on retracement continues.
And if price broken down of channel is is rejected,
target could be 30406.
Possible scenarios:
1) Continue of upward momentum for long on retracement
3) Rejection at previous supply zone + breakdown of channel for short
Price reaction levels
Short on Test and Reject | Long on Test and Accept
32563 31867
30406 29639 26212
Weekly: Ave vol up bar close at high = strength
Daily: Ave vol up bar close off high = minor weakness
H4: High vol narrow spread up bar followed by ave vol up bar close off high = weakness
Remember to like and follow if you find this useful.
Have a profitable week ahead.

YM1! - Weekly Market Update, 8/1/22Dow Futures post a countertrend BUY signal ... Ideal entry, stop and target imaged on the chart.
Support and Resistance structures have been adjusted accordingly for your reference.
Wishing you a blessed and profitable week ahead.

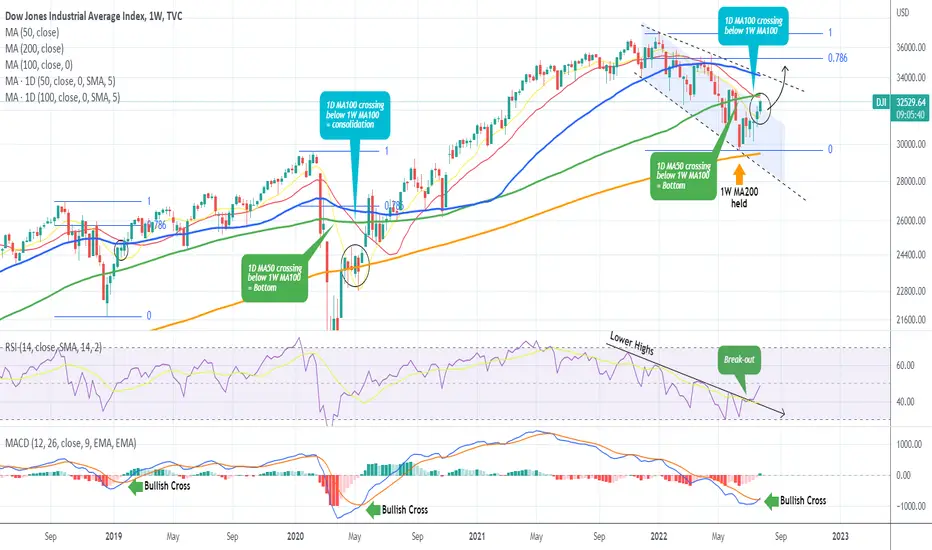
DOW JONES has formed a 2018/2020 type bottom.The Dow Jones Industrial Average Index (DJI) made the first bullish step as we outlined last week by breaking above its 1D MA50 (yellow trend-line) and is currently just below the 1D MA100 (red trend-line) and 1W MA100 (green trend-line). In the process it has made the exact same build up as the COVID bottom and subsequent recovery but let's see into this in more detail.
First and foremost, it achieved this week the 1W MACD Bullish Cross. It is the first such formation below the 0.00 level since May 18 2020 and January 28 2019. Those were the Bullish Crosses that followed the COVID crash and U.S. - Chine trade war bottoms respectively and took the index into the early recovery steps. On top of that, it broke above a Lower Highs sequence on the 1W RSI that was holding since November 01 2021.
Moving on to the MA periods, we can see than during the COVID crash, when the 1D MA50 crossed below the 1W MA100, the bottom was formed. That is also the case with the current correction as the same 1D MA50/ 1W MA100 Bearish Cross has so far formed a low on the June 13 1W candle. Back again to the COVID crash, when the 1D MA100 crossed below the 1W MA100, the index was consolidating preparing for a strong rise above the 0.786 Fibonacci retracement level. On today's correction, we are just after this Bearish Cross, with the index already on two straight (very strong) 1W green candles.
We can see that even in January 2019, the index had a similar consolidation within the 1D MA50 and 1D MA100 before a break above the latter pushed Dow Jones aggressively above the 0.786 Fib. In both sequences, all this happened after a 1W MACD Bullish Cross (as we have today), while the 1D MA50 was holding as a Support.
Even though the pattern since the start of the year is a Channel Down within a Bearish Megaphone, with the 1W MA50 (blue trend-line) located exactly on the Megaphone's Lower Highs (top) trend-line, we do have an excellent framework to work projections based on MA break-outs, modelled out of the similar 2018/ 2020 patterns.
This time the 0.786 Fib is around 35250 and this is our target for the end of Q3.
--------------------------------------------------------------------------------------------------------
** Please support this idea with your likes and comments, it is the best way to keep it relevant and support me. **
--------------------------------------------------------------------------------------------------------
DJI to $14,500 in July 2032?Do we revert to the 50 year mean in 2032? That would put the Dow at 14,500 in 2032 if the cycle repeats.
Found it very interesting that it was exactly 50 years to get a low & bounce from the Great Depression bottom.
Every mega bear market is different so IF this is the start of another mega bear market that takes us to the lower blue line on this log chart then I doubt it will be labeled "Great Depression or Stagflation".
Great Depression-Lasted 3 years
Stagflation-Lasted 16.5 years
Jan 2022-July 2032=10.5 years (16.5+3=19.5 years and then divide that by 2 and you could conceivably say 10.5 years of whatever we will call it does make sense from a timeframe perspective).
Either way, IFFFF we are in a mega bear market the chart won't look identical to either the Great Depression nor Stagflation...it will have it's own uniqueness and it's own name.
For now, I'm just looking for the open weekly gaps on the DJI to get cleared seeing as those have ALWAYS cleared. Open weekly gaps are at 28,495.05 and 24,718.46

US30USD YM1! DOW 2022 JULY 25 Week
US30USD YM1! DOW 2022 JULY 25 Week
Last week's long preference worked well.
Weakness shown over 3 TF analysis. We may see
short opportunity temporarily.
Possible scenarios:
2) Market rotation = trade at boundary of range
3) Behavior change scenario
Price reaction levels
Short on Test and Reject | Long on Test and Accept
32563 31867
30406 29639 26212
Weekly: Ave vol up bar close off high = weakness
Daily: Ave vol UT bar = weakness
H4: Ave vol tiny spread up bar = weakness
Remember to like and follow if you find this useful.
Have a profitable week ahead.

DowJones Targeting the Equality Objective & HVNIn this update we review the recent price action in the DowJones futures contract and identify the next high probability trading opportunity and price objectives to target

E-MINI DOW JONES ($5) FUTURESGood ascent but faced very strong resistance and start coming down and we can watch it at the bottom call.

US30USD YM1! DOW 2022 JULY 18 Week
US30USD YM1! DOW 2022 JULY 18 Week
Last week, rotation strategy worked well again. Point to note for Dow, unlike
NASDAQ and SNP, we didn't see bullish volume returning.
So we will still adopt the rotation strategy.
Also with minor strength on Weekly tf, we can also look for long oppportunity
on retracement.
Possible scenarios:
2) Market rotation = trade at boundary of range
3) Behavior change scenario
4) Trend continuation - channel boundary trades
Price reaction levels
Short on Test and Reject | Long on Test and Accept
32563 31867
30406 29639 26212
Weekly: Ave vol down bar close toward high = minor strength
Daily: Ave vol u bar close at high = minor strength
H4: Very high vol narrow spread up bar close off high
followed by ave vol tiny spread up bar = weakness
Remember to like and follow if you find this useful.
Have a profitable week ahead.
