US30USD YM1! Dow 2021 Nov 15 WeekYM1!
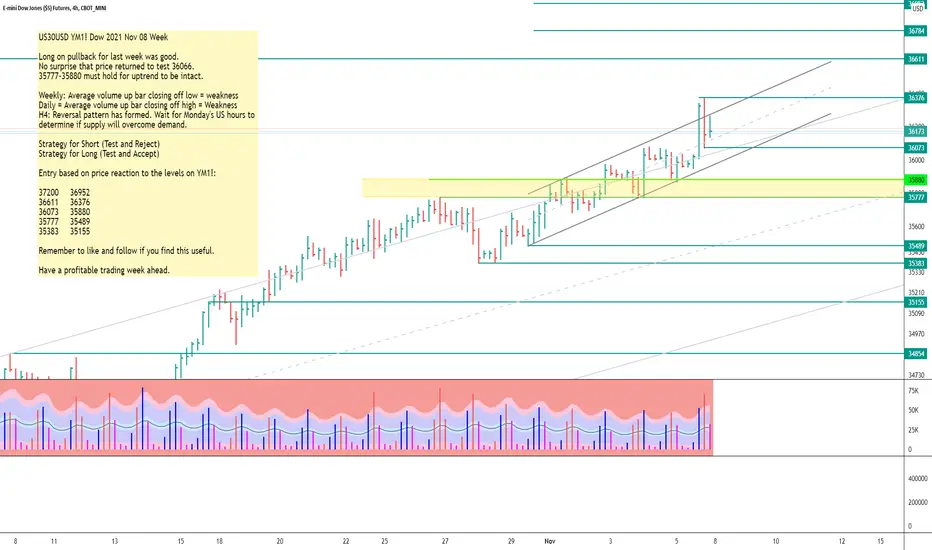
US30USD YM1! Dow 2021 Nov 15 Week
Demand at 35777-35880 returned to support the market on Friday.
However a downtrend channel has formed. acceptance at 36135 will mean
resumption of uptrend.
Weekly: Average volume very wide spread down bar closing off low
= some demand present.
Daily = Average volume up bar closing off high = Weakness.
However behavior appears like a bullish reversal.
H4: Ultra High volume wide spread up bar
closing off high, followed by an up bar closing off high. Weakness expected.
Strategy for Long (Test and Accept)
Entry based on price reaction to the levels on YM1!:
37200 36952
36762 36446
36375 36255
35880 36135
36076 25880
35777 35520
35500 35250
35151
Remember to like and follow if you find this useful.
Have a profitable trading week ahead.
YM1!

Emini Dow Wave 5 TradeIn this update we identify a high probability trade location to trade for a 5th wave upside extension

YMYm1, an eosinophilic chemotactic factor, participates in the brain inflammation induced by Angiostrongylus cantonensis in mice
Ym1, an eosinophilic chemotactic factor, participates in the brain inflammation induced by Angiostrongylus cantonensis in mice
Ym1, an eosinophilic chemotactic factor, participates in the brain inflammation induced by Angiostrongylus cantonensis in mice
Ym1, an eosinophilic chemotactic factor, participates in the brain inflammation induced by Angiostrongylus cantonensis in mice


Emini Dow Playing A Wave 4 CorrectionIn this update we review the current bullish sequence in the Dow and identify two high probability trade locations to play a wave 4 correction and then the wave 5 extension to the upside

be carefull , dow easily can go down(mini crash) to green arrow in green arrow we can pick buy (buylimit) with sl=80
note=we have sell divergance on dow too
for buy dont hurryup , wait until near green arrow

US30USD YM1! Dow 2021 Nov 08 WeekYM1!
US30USD YM1! Dow 2021 Nov 08 Week
Long on pullback for last week was good.
No surprise that price returned to test 36066.
35777-35880 must hold for uptrend to be intact.
Weekly: Average volume up bar closing off low = weakness
Daily = Average volume up bar closing off high = Weakness
H4: Reversal pattern has formed. Wait for Monday's US hours to
determine if supply will overcome demand.
Strategy for Short (Test and Reject)
Strategy for Long (Test and Accept)
Entry based on price reaction to the levels on YM1!:
37200 36952
36611 36376
36073 35880
35777 35489
35383 35155
Remember to like and follow if you find this useful.
Have a profitable trading week ahead.
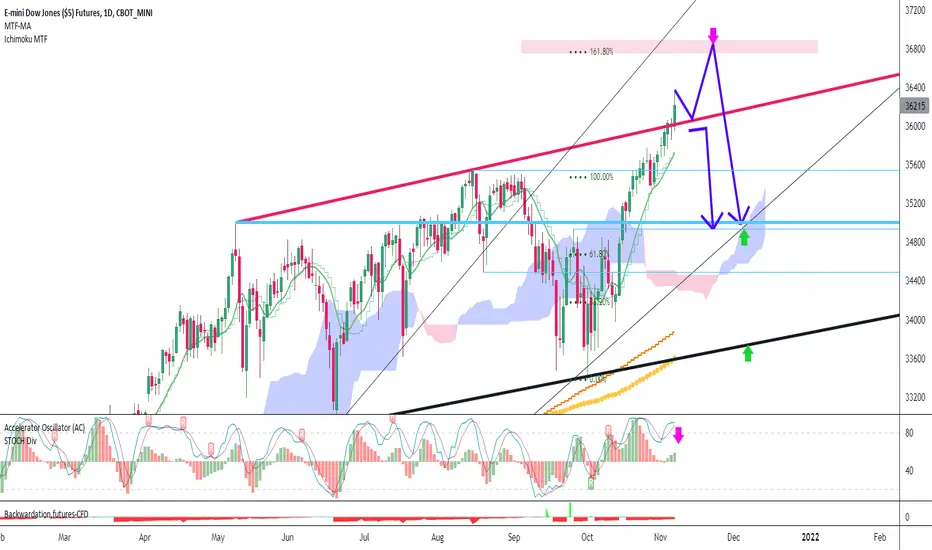
ALERT: for next 30 day we predict dow crash to 35000 2 scenario can happen on dow for coming days
come down little touch red trend line then go to fibo 161% 36800 then crash to 35000 , it is very very important support
or
little by little range then down move (save in your mine = break red trendline and 1hour EMA200 (green line) mean down trend start
dow fut COT data , net open order big banks and fund managers
prnt.sc
US30USD YM1! Dow 2021 Nov 01 WeekYM1!
US30USD YM1! Dow 2021 Nov 01 Week
Previous high test and reject and Test and accept of 35365 were good.
Weakness expected, but no change in trend yet.
Strategy will be to Long on test of lower level
and short on rejection of higher prices
Weekly: Narrowing of spread even on higher volume = weakness
(no change in behavior yet)
Daily = Average volume up bar closing off high = Weakness
H4: Shortening of thrust.
Significant bearish volume observed since the ascend = Weakness
Strategy for Short (Test and Reject)
Strategy for Long (Test and Accept)
Entry based on price reaction to the levels on YM1!:
36000
35645 35541
35365 35155
34854 34489
34126 33610
Remember to like and follow if you find this useful.
Have a profitable trading week ahead.

Emini DowIn this update we review the current structure for the Emini Dow/YM, identifying some high probability trade locations

US30USD YM1! Dow 2021 Oct 25 Week
US30USD YM1! Dow 2021 Oct 25 Week
Market approaching previous high
Some whipsaw expected. Preference is to long when
price come to test the lower levels.
Weekly: Price advanced on lower volume. Spread has narrowed = weakness
(no change in behavior yet)
H4: UHV Upthrust bar with strength in background.
If next bar closes higher, this then can be confirmed = weakness
Strategy for Short (Test and Reject)
Strategy for Long (Test and Accept)
Entry based on price reaction to the levels on YM1!:
36000
35645 35541
35365 35155
34854 34489
34126 33610
Remember to like and follow if you find this useful.
Have a profitable trading week ahead. YM1!

US30USD YM1! Dow 2021 Oct 18 WeekYM1!
US30USD YM1! Dow 2021 Oct 18 Week
Market approaching previous high
Some whipsaw expected. Preference is to long when
price come to test the lower levels.
Weekly: High volume up bar closing at high = Strength
Daily: High volume up bar closing on high = Strength
H3: Shortening of thrust in the last few bars.
Keep stops tight if long. Wait for price to
return to lower levels and long when price finds
acceptance.
Strategy for Short (Test and Reject)
Strategy for Long (Test and Accept)
Entry based on price reaction to the levels on YM1!:
36611 34489
36000 34126
35547 33908
35347 33610
35171 33383
35000 32858
Remember to like and follow if you find this useful.
Have a profitable trading week ahead.

Short Dow Jones - Wolfe WavesWolfe wave pattern.
1. Wait for the price to come to the "sweet zone".
2. Enter on the exit from "sweet zone".
3. Take profit if the price touches the vertical pink line (TP1).
4. Take profit 50% if the price comes to lower line of the channel (TP2). Set the stop to breakeven.
5. Take profit 100% if the price comes to lowest diagonal line (TP3).
Remark:
Pattern will be invalidated if it gets above the "sweet zone" (purple area).

US30USD YM1! Dow 2021 Oct 11 Week
YM1!
US30USD YM1! Dow 2021 Oct 11 Week
Market had been ranging for 3 weeks, still awaiting resolution of
supply and demand.
Weekly: High volume up bar closing off high = some supply present.
Daily: Friday saw low volume up bar closing off high = Weakness
H3: Some demand has returned to support the market from 06 Oct. YM1!
Friday's effort from sellers didn't yield much result = Some strength
Strategy for Short (Test and Reject)
Strategy for Long (Test and Accept)
Entry based on price reaction to the levels on YM1!:
32220 - 32250
33383 - 33478
33715 34126
34364 34854-34934
34554 34674
35250 35500 - 35550
Remember to like and follow if you find this useful.
Have a profitable trading week ahead.

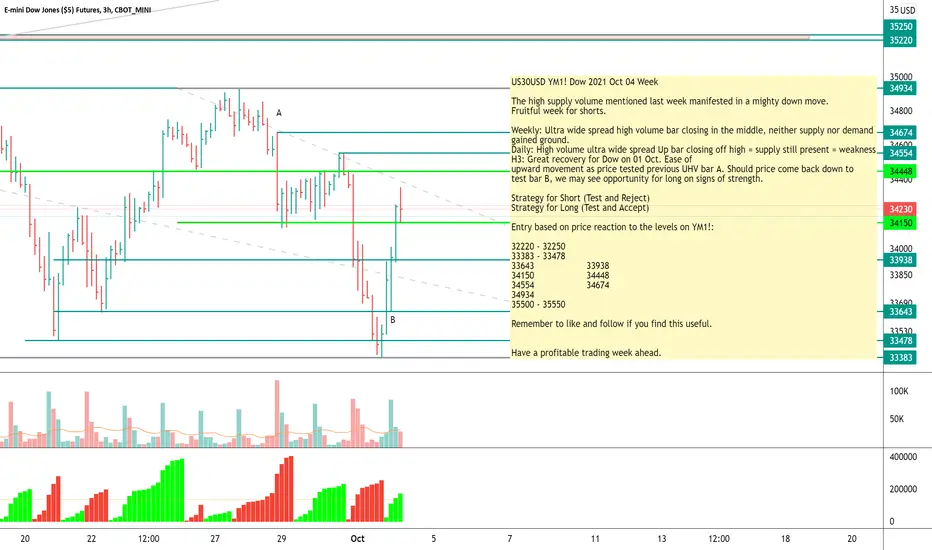
US30USD YM1! Dow 2021 Oct 04 WeekYM1!
US30USD YM1! Dow 2021 Oct 04 Week
The high supply volume mentioned last week manifested in a mighty down move.
Fruitful week for shorts.
Weekly: Ultra wide spread high volume bar closing in the middle, neither supply nor demand
gained ground.
Daily: High volume ultra wide spread Up bar closing off high = supply still present = weakness
H3: Great recovery for Dow on 01 Oct. Ease of
upward movement as price tested previous UHV bar A. Should price come back down to
test bar B, we may see opportunity for long on signs of strength.
Strategy for Short (Test and Reject)
Strategy for Long (Test and Accept)
Entry based on price reaction to the levels on YM1!:
32220 - 32250
33383 - 33478
33643 33938
34150 34448
34554 34674
34934
35500 - 35550
Remember to like and follow if you find this useful.
Have a profitable trading week ahead.
Dow Futures have completed wave five to the downsideDow Futures have completed wave five to the downside; what is the next move from here?
Dow Futures have bounced back at 33370 and completed wave five pullback sequences, indicating a potential change in direction could be on the horizon. However, the Index is still trading in a bearish channel and needs to break out of the downtrend to establish the next leg up.
Two scenarios could develop in next week's session.
The Index could hit the top of the channel and pull back to 33770 or 33370 to start the next sequence of five-wave patterns to the upside or pull back below 33370 and continue to the downside.

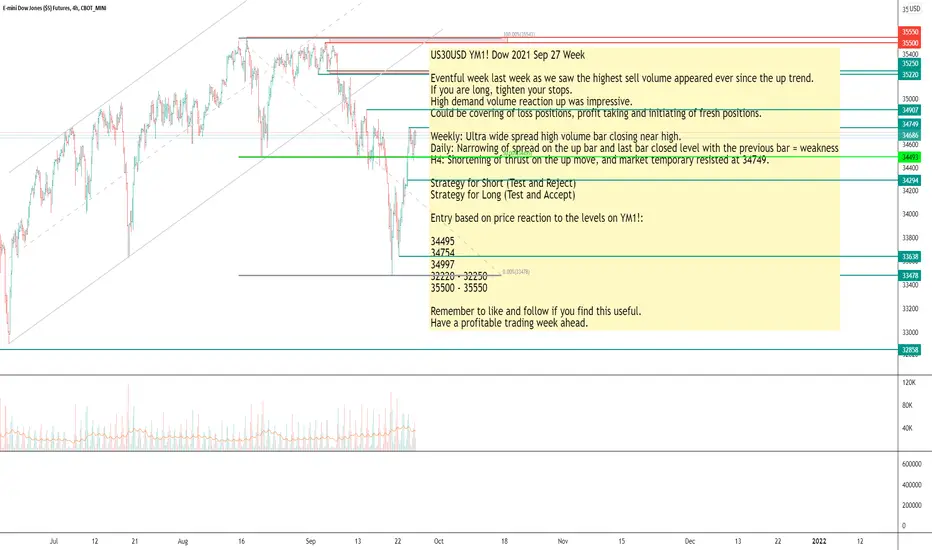
US30USD YM1! Dow 2021 Sep 27 WeekYM1!
US30USD YM1! Dow 2021 Sep 27 Week
Eventful week last week as we saw the highest sell volume appeared ever since the up trend.
If you are long, tighten your stops.
High demand volume reaction up was impressive.
Could be covering of loss positions, profit taking and initiating of fresh positions.
Weekly: Ultra wide spread high volume bar closing near high.
Daily: Narrowing of spread on the up bar and last bar closed level with the previous bar = weakness
H4: Shortening of thrust on the up move, and market temporary resisted at 34749.
Strategy for Short (Test and Reject)
Strategy for Long (Test and Accept)
Entry based on price reaction to the levels on YM1!:
34495
34754
34997
32220 - 32250
35500 - 35550
Remember to like and follow if you find this useful.
Have a profitable trading week ahead.
ES MFI overboughtMFI way overbought, RSI is not there yet. Typically this leads to a pump and dump Friday, so probably a gap up tomorrow then dump, though the other scenario is Thu afternoon dump followed by an up Friday. We've all seen that before.
All other indices look similar.

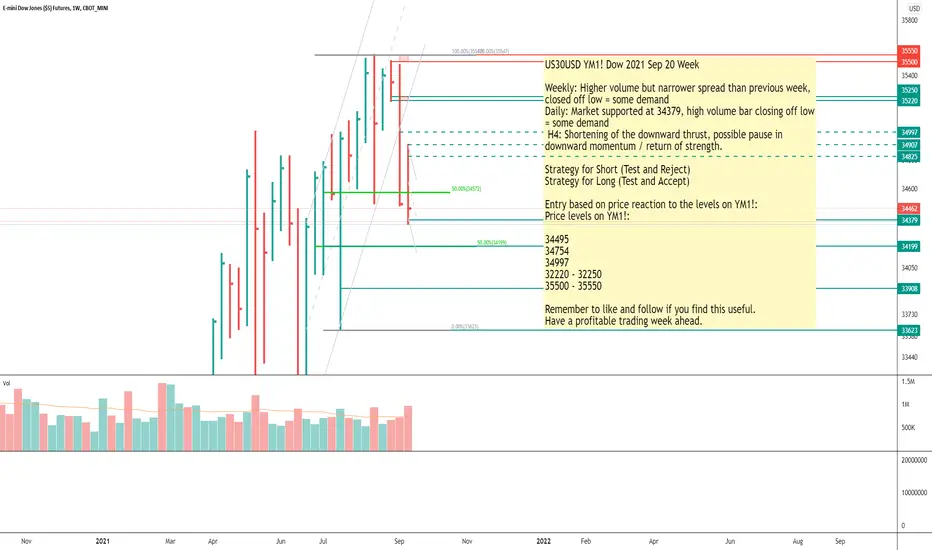
US30USD YM1! Dow 2021 Sep 20 WeekYM1!
US30USD YM1! Dow 2021 Sep 20 Week
Weekly: Higher volume but narrower spread than previous week,
closed off low = some demand
Daily: Market supported at 34379, high volume bar closing off low
= some demand
H4: Shortening of the downward thrust, possible pause in
downward momentum / return of strength.
Strategy for Short (Test and Reject)
Strategy for Long (Test and Accept)
Entry based on price reaction to the levels on YM1!:
Price levels on YM1!:
34495
34754
34997
32220 - 32250
35500 - 35550
Remember to like and follow if you find this useful.
Have a profitable trading week ahead.
US30USD YM1! Dow 2021 Sep 13 WeekYM1!
US30USD YM1! Dow 2021 Sep 13 Week
Weekly/Daily: Ultra Wide Spread down bar closing on low, took out previous low 34494.
Will this previous support hold?
Potential for spring IF price can close above 34494 in LTF.
H4: Diminishing volume on decline, we may see some strength return.
Strategy for Short (Test and Reject)
Strategy for Long (Test and Accept)
Entry based on price reaction to the levels on YM1!:
Price levels on YM1!:
34495
34754
34997
32220 - 32250
35500 - 35550
Remember to like and follow if you find this useful.
Have a profitable trading week ahead.

US30USD YM1! Dow 2021 Sep 06 WeekYM1!
US30USD YM1! Dow 2021 Sep 06 Week
Shorting on weakness was good as price was rejected at the 35500 region several times.
Weekly: Narrow spread down bar. Price broke through previous week's high but closed below
the previous bar = Weakness.
Daily = Rotation, whipsaw expected. Last bar is down bar closing below 50% = weakness.
H4: Rotation, whipsaw expected. Up bar yielded no result = weakness
Entry based on price reaction on Red/Green zones.
Strategy for Short (Test and Reject)
Strategy for Long (Test and Accept)
Price levels on YM1!:
35550- 35500
35220 - 35250
35114
34775
34569
34495
Remember to like and follow if you find this useful.
Have a profitable trading week ahead.

US30USD YM1! Dow 2021 Aug 30 WeekYM1!
US30USD YM1! Dow 2021 Aug 30 Week
Market approaching previous high. Weekly/Daily still uptrend,
H4 still rotation.
Preference is to short when price breaks resistance and closes below it.
If it is breakout, then wait for price to return to breakout level and long.
Weekly: High volume up bar = Strength
Daily: High Volume Up Bar approaching recent resistance
H4: UHV Ultra Wide Spread Up bar followed by upthrust = Weakness
H1: No demand closing off high = weakness
Entry based on price reaction at Red/Green zones.
Strategy for Short (Test and Reject)
Strategy for Long (Test and Accept)
Price levels on YM1!:
35535 - 35420
35403
35151
35114
34924
34606
34535
Remember to like and follow if you find this useful.
Have a profitable trading week ahead.

US30USD YM1! Dow 2021 Aug 23 WeekYM1!
US30USD
US30USD YM1! Dow 2021 Aug 23 Week
Weakness per last week's analysis proved profitable.
Weekly: Ultra Wide Spread UHV down bar close in middle = Strength
Daily: Up bar on high volume close above high of previous bar = Strength.
H4 = Higher low formed
Strategy for Long (test and accept)
1) 34495 - 34569
2) 34775
3) 34948
Strategy for Short (test and reject)
1) 35540
2) 35285
3) 35151
Remember to like and follow if you find this useful.
Have a profitable trading week ahead.
