YM1!

𝗗𝗼𝘄 𝗨𝗽𝗱𝗮𝘁𝗲: $YM_F Daily. Retest of Feb ’20 High HoldsRetest of Feb ’20 highs as support held and a big reaction. $NQ_F leading but won’t be surprised if other sectors join
$DJI $DIA $SPX $SPY $ES_F $NDX $QQQ $VIX #DowJones #ElliottWave #Trading #Stocks


90.7 DXY Dollar is the key to the stocks correction!!!If the Dollar gets over 90.7, that should signal the correction in all assets. 90.7 is the *yearly* 20 period moving average. Rejected twice this past week, but it has broken out of a wedge pattern, backtested successfully, and seems to want to move up to get over 90.7. Target 92.3-92.5 for the short term resistance and green light to long stocks. 90.99 is a gap and also a target.


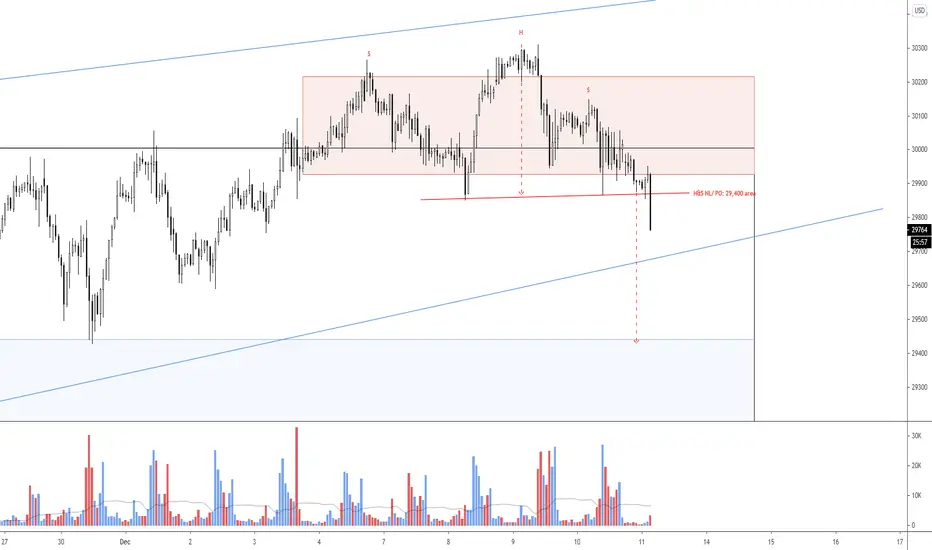
Dow future (12/1/20)Although there are many counts, I find this count more reliable. I feel the rise in dowjones from march is a correction wave and we about to witness huge correction. For short term traders, I advise buying at any minor correction with the target near 30200. Good luck.

YM MFI bounced off oversoldAsia down, Europe up....
YM MFI bounced off oversold. Looks like a whipsaw week...

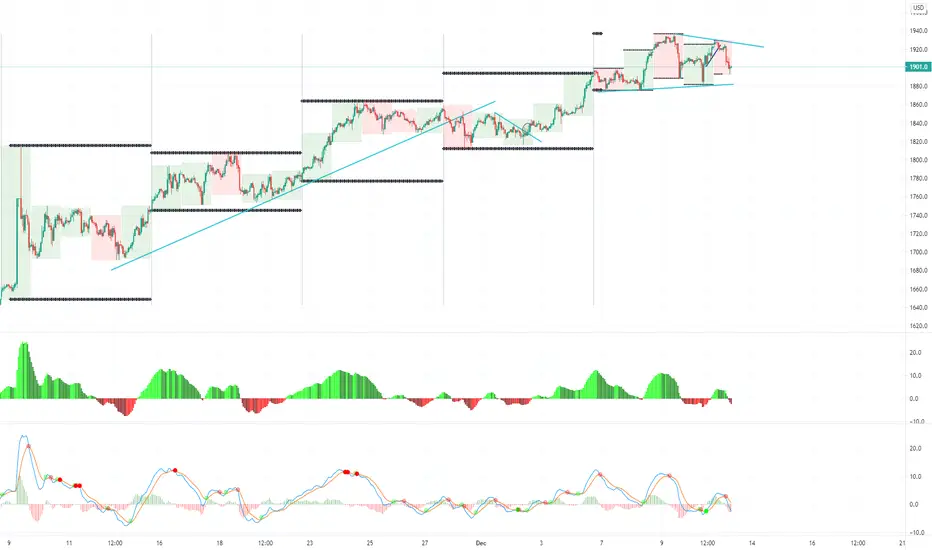
Could this indicator predict corrections 100% of the time?!The cyan line is a weighted average of different asset classes, other than stocks, that I came up with.
It is just a mathematical exercise but I thought it is showing some VERY interesting correlation...
... Just a thought!
Disclaimer: The above is not an investment advice. It is merely an opinion and I share it for your entertainment only. Do your own due diligence and above all, trade safely and stay safe!

Could the real Black Friday be December 11th?The stock market indices are at all time high, climbing the wall of worried of the megaphone resistance.
Meanwhile:
- There is 20 million Americans unemployed
- Covid-19 is at all time high
- Stimulus is ending at the end of the month and there are no visibility as to whet and when the next wave of stimulus will be.
Yes, there is a vaccine coming but vaccination will take time...
With Thanksgiving Travel and gatherings and the return of the cold weather in some regions, the spread of the virus could be out of control. Then, to make things worse, Christmas and New Year is also just around the corner with more gathering in sight.
Considering symptoms appear between 2 to 14 days after being infected, that would mean that between December 3rd and December 10th, a Covid-19 spike could erupt in many US regions. So, without putting to much credibility on the exact date, I believe things will get worse before they get better.
We could see SPY fall from its megaphone soon!
Disclaimer: The above is not an investment advice. It is merely an idea and an opinion and I share it for your entertainment only. Do your own due diligence and above all, trade safely and stay safe!

Dow future (11/27/20)I think there is another upside rise before a huge drop. For the short-term trader, I recommend buying now with a stop loss of the previous bottom.


𝗗𝗼𝘄 𝗨𝗽𝗱𝗮𝘁𝗲: $YM_F Daily. 🎅🏼📈 into Year End?Held support area ~$26K and channel broke out to new ATH. Over $30K and will likely see a 🎅🏼📈 into year end
$DJI $DIA $SPX $SPY $ES_F $NDX $QQQ $NQ_F $VIX #DowJones #ElliottWave #Trading #Stocks


Dow Emini (YM1) LONGProbably an other run at the gap. (S&P is likely a better long, though!... for now.)

Healthy Correct on Dow1. Price is potentially at its healthy correction after the passed long-hauled rally.
2. It is seems possibly to squeeze deeper within demand zone, to hunt further stop-loss. Would not be surprise to see long wick bullish pin bar to appear around this level.
3. However, it shall steadily supported around fib 50% to 61.8%, which where next pivot level to be formed.
4. It shall then rally to challenge the next swing high level - 28835.
May the market be with you!

Significant downside for US equitiesThe bottom indicator suggests any change in momentum will be downward as several different momentum lengths are all peaking around the same time,
Notes: US30 (AKA Dow, YM) In upper chart in RENKO
Therefor the time axis is irregular. But the time of interest is NOW (where the penguin lies)

Dow /YM Potential breakout on IndustrialsThe Dow is lagging our other indices in our tech-heavy environment. Technicals are ripe for a play. 27900 28020 & 28400 resistance range. Bullish pattern setup with inverted h&s and hugging the downtrend breakout. Potentially an ascending triangle forming-- Let's see if the bulls can break up. Play break out or short the rejection.

Reversing Short to Long at 27696
The Ingenuity Trading Model is a Hidden Markov Model with specific inputs related to Price, Time, Volume , and Volatility .

SPY is diverging from the Global economy?The premise: SPY and the major US stock markets in general seem to be disconnected from the real state of the world's economy. This can't Iast long. So, I decided to toy with the idea that the true state of the economy is captured in the world various stock exchanges combined. So, is there a way that a world economy indicator could be built to plot the true economic trend and then be predictive?
Of course, I do not have the data to build such an index but the blue line shown in this chart is my attempt to capture the world's stock exchange trend (mood). It is based on weighted averages of several world indices. It seems to say that the US stock markets (SPY in this case) is diverging from the world's macro trend right now and...
...Look at what happened last time SPY diverged from this indicator!
Of course this indicator is entirely made up so, take this with a grain of salt. Also, a surprise stimulus from Washington could mix up the cards but...nevertheless I thought it was an idea worth sharing and... an indicator worth monitoring...
Disclaimer: The above is not an investment advice. It is merely an opinion and I share it for your entertainment only. Do your own due diligence and above all, trade safely and stay safe!

YM : Trapped sellersThe gap up on Sunday trapped a bunch of sellers, who would have a strong desire to exit when price comes back to them.

Thoughts on the S&P through end of 2020TVC:SPX AMEX:SPY CME_MINI:ES1! CME_MINI:ES1!
Well, the S&P; has made a crazy trip from Yearly S2 to Yearly R1 in what has certainly been a psychotic 2020 -- one that isn't over yet. On this weekly chart, I'd like to point out the firm rejection on R1 and then the follow through to the downside this week. While it wasn't crazy-strong follow through, it's certainly enough to make anyone paying attention take note. What's worse is that we have weakening RSI showing major divergence vs. the previous high, and also just a general divergence going back a few years before RSI reset this past March after hitting 30. What that means is that there just isn't the same momentum going into the last two highs as there was a few years ago. Breaking above 70 and then rejecting the 70 level is about as bearish as it gets. Taking a look at the Stochastic, the divergence is not as notable there as in RSI, so maybe that's somewhat of a silver lining. But, it does appear a bearish crossover will occur in the next week or two. I use the stochastic to confirm RSI, not the other way around as it tends to lag significantly, especially on longer time frames like weekly charts. Kinda looks like one of those setups where a few weeks later I think to myself "I should've taken the warning signs more seriously". If you take a look at the 4 hour chart, you'll notice a pretty sketchy hear & shoulders top with today's close right on the neckline. Joy . Things could start getting sketchy as soon as next week.
So, if this is correct, and we're trending lower now, how low will we go? My guess is somewhere between S2 or S3 by the end of the year. That 1900 area is certainly strong support and should almost definitely be defended. After that, who knows? With everything as batshit crazy as it has been this year, there's no telling what next year will look like. My advice? Pack it in for the year or at least until the political cycle is behind us here in the US.
Good luck everybody.
