Are small caps telling us something?Disclaimer: The above is just an idea for your entertainment, not a trading advice!
YM1!


What if the markets were surprised ... !!??Everybody expects the FED to lower rates by 25 bp this week.
But ... :
- The markets are near all time high
- China US are talking
- Brexit is almost surely pushed
Ok some indicators are softening but with uncertainty lower (still very present but lower) what if they would decide to pause instead? That would be highly unexpected and that would create a nice reaction to the down side in the markets. If the FED lowers rates by 25bp, the reaction will be minimal because it is already priced in with 97% certainty. It is the surprise effect of leaving the rates unchanged that could be interesting this week!
I am not saying it will happen, but what if...?
This is not a trading advice. Just an idea...

Dow Jones: Channel Up turned into a Triangle.Dow Jones is extending the rebound on the Higher Low made yesterday on the 1W Channel Up (RSI = 51.067, MACD = 249.310, Highs/Lows = 0.0000) after the Nonfarm Payrolls missed the forecast today. This fundamentally bullish for the stock index (Fed and rate cut outlook).
Technically the 1W Channel Up failed to make a Higher High last month so the medium term overlay can turn into a Triangle. Thus we revise our target on a Lower High at 27,200.
** If you like our free content follow our profile (www.tradingview.com) to get more daily ideas. **
Comments and likes are greatly appreciated.

Dow Jones - Sell on Worse ISM!Markets are now very sensitive to data.
Worse ISM on Tuesday and worse ADP yesterday
have sent stocks lower and have generated a broad risk-off tone.
Today everything hinges on the ISM Non-Manuf.
report due at 16.00 CET.
If, as we expect, the print comes in worse, we will look to sell the Dow.
Target is 25250s.

YM1!., Pullback on H4: SellYM1!., Pullback on H4: Sell
H4:
- Structure: uptrend
- Tendency: Upward
However:
- Weakening
- Test resistance and below
=> Correction ( pullback)
PLAN: As picture

YM1!, Buy on H4.YM1!, Buy on H4.
H4:
- Structure: Uptrend
- Tendency: Upward
- Break and above support
- Re-test support and move up
- Candle: Bullish candle
=> UP

$DIA $DJI $DJIA $DJ_F - Dow Testing Key Monthly ResistanceAs market volatility has died down in recent sessions, off the back of calming geopolitical tensions in Hong Kong, as well as between US-China, it appears that the $DJI has broken out of its "Channel" formation and is moving higher.
Given this move, the $DJI is trying to make a run for 26,876 - a Key Monthly Resistance Level (Blue) for the index.
One thing to lend support to the $DJI move higher has been the fact that its RSI is showing positive divergence with current price action.
If the $DJI can successfully "Breach and Close" above 26,876, it would be a good sign for the market.
Investors should watch this space.

DJI bearsh viewBased on the chart, it is supposed the index will fall from the current levels. Aggressive traders should take positions early.

Dow Jones - Trade the Data into NY! Eyes on Dow and risk appetite today into the NY session. It's going to be an important two days for U.S. stock investors. A slew of economic data from payrolls to services PMI figures to durable goods orders have taken on even more significance, after the unexpectedly poor reading from the ISM purchasing manager's index this week.
With many investors pointing to a strong labor market as a reason for their preference for U.S. assets, traders will be particularly sensitive to the ADP employment data today and of course non-farm payrolls Friday.
The ISM's gauge of factory employment fell to the lowest since March 2016, which suggests there could be pressure on manufacturing payrolls.
Data-driven moves are the key today.

Dow Jones: Golden Cross on 4H. Strong buy opportunity.The index is coming off a 1D Resistance (26,400) break out last week that practically broke the August consolidation range. The upside stopped on the median of the 1W Channel Up (RSI = 52.840, MACD = 209.700, Highs/Lows = 0.0000) just above the 4H MA200.
The candle action is very similar to the previous High-Low pattern, where after a the Death Cross confirmed the downtrend to a Higher Low, the Golden Cross confirmed the uptrend to the Higher High. The Golden Cross is about to take place on 4H and that should be your buy signal towards a new Higher High. We are willing to take that buy aiming at a Higher High price of 27,850.
** If you like our free content follow our profile (www.tradingview.com) to get more daily ideas. **
Comments and likes are greatly appreciated.

DJI future for short term There are two bearish count for DJI. The first count I suggest that wave b completed and we in wave 2 of wave c. The count will be invalid if price moves up to 26378. the other count shows that we are in the wave b which unfold as triangle. trade wisely and don't forget to manage ur trade.

Dow Jones - Sell Continuation Breaks!Equity markets are lower today, on the back of
lingering trade uncertainty and also HK protests.
Embattled Hong Kong leader Lam said the Asian
financial center is at risk of sliding into an
“abyss". This is influential since it is de-facto a
Chinese matter, which won't help the already
tense international situation with the US.
We continue to expect downside in equities
today. Sell continuation breaks.

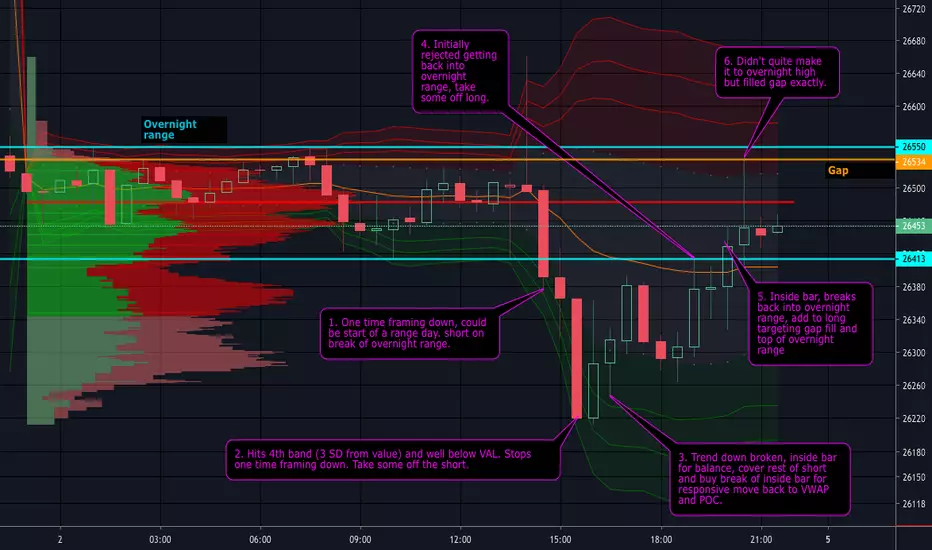
Day trading YM 2 Aug with volume profile + VWAPExplanation on the chart.
I use this along with ADD/TICK/UVOL-DVOL for internals to ensure i'm not going against the grain.
Other important reference points are previous days and weeks range.
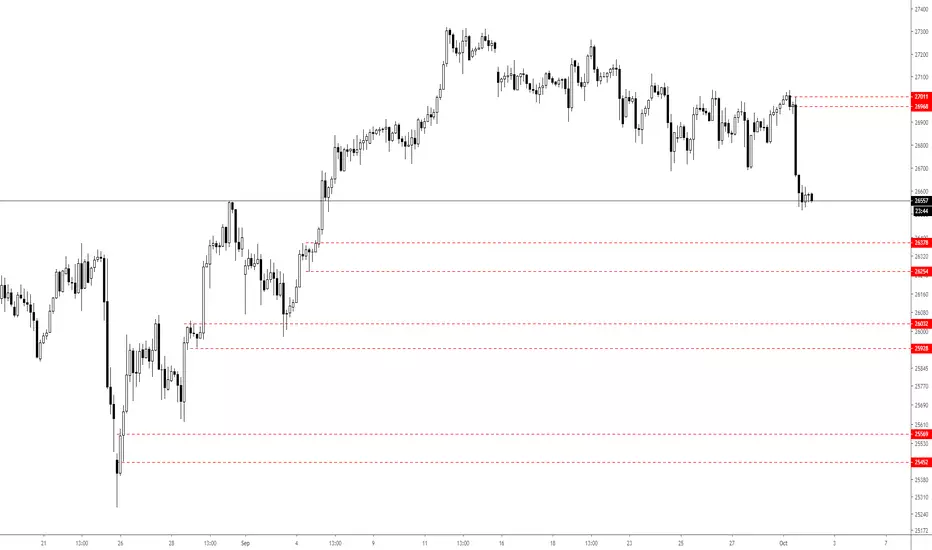
Volume profile analysis for DJI/YMValue has moved down with price which is bearish, but it has left some poor structure with several distributions above. Price touched the previous balance area- marked in yellow-before being rejected so a bounce here is likely. There are several virgin volume POCs below to hunt down with targets being 25615, 25250, and 24770.

Dow Jones - Continuation Breakout Setting Up!The Dow fell more than 1% on the FOMC decision
as further rate cuts are not guaranteed. Actually
the way traders interpreted this is that the cut
was an "insurance cut", with no more to come.
Equity markets are feeling the force of gravity from
the yield curve movements.
We like the odds of further softness today,
but would only play continuation breakouts
when Wall Street opens.

#FXinsights USDHKD Daily #TradingViewTOOLKIT YM1! FUTURESinFocus#proTRADING with #TradingViewTOOLKIT @YouTube
CBOT_MINI:YM1! MarketWATCH
SHORT

Dow Jones - Continuation Longs in Play!Stocks are higher on a combination of factors:
positive results from Microsoft;
news that Mnuchin and Lighthizer spoke again
with Chinese officials yesterday;
FED's Williams hinting at a stronger easing bias.
We like the odds of continuation today, looking
for new all-time highs in the Dow.

Dow Jones - Buy on Pullbacks!Stocks received a boost from the more positive headlines
relating to Huawei (which was on the US Black list).
This led to a big push in the equities markets,
which is continuing still.
The trend is up and pullbacks are favoured after the dovish FOMC.

YM E-mini Dow Jones - pushing to new highs?Daily YM E-mini Dow Jones chart showing possible BULLISH TREND pushing to new highs - currently up against RESISTANCE

