Weekly Market Forecast Jan 27 - 31stThis is an outlook for the week of Jan 27-31st.
In this video, we will analyze the following FX markets:
ES \ S&P 500
NQ | NASDAQ 100
YM | Dow Jones 30
GC |Gold
SiI | Silver
PL | Platinum
HG | Copper
The indices are still moving higher, as investors are moving money from the USD to the equity markets, riding the Trump Pump. We'll see how long the euphoria will last, and how the market responds to a bevy of policy initiatives and executive orders by the US President.
Enjoy!
May profits be upon you.
Leave any questions or comments in the comment section.
I appreciate any feedback from my viewers!
Like and/or subscribe if you want more accurate analysis.
Thank you so much!
Disclaimer:
I do not provide personal investment advice and I am not a qualified licensed investment advisor.
All information found here, including any ideas, opinions, views, predictions, forecasts, commentaries, suggestions, expressed or implied herein, are for informational, entertainment or educational purposes only and should not be construed as personal investment advice. While the information provided is believed to be accurate, it may include errors or inaccuracies.
I will not and cannot be held liable for any actions you take as a result of anything you read here.
Conduct your own due diligence, or consult a licensed financial advisor or broker before making any and all investment decisions. Any investments, trades, speculations, or decisions made on the basis of any information found on this channel, expressed or implied herein, are committed at your own risk, financial or otherwise.
YM1!

DOW has a full Bull year ahead based on PRESIDENT'S CHEATSHEETDow Jones (DJI) has started the year on a positive note and that is anything but a coincidence. On this 1W chart you can see Dow's price action since the early 2009 bottom of the U.S. Housing Crisis.
That happened to be Obama's 1st year of Presidency. As you can see, 2009 was an incredibly bullish year with the index rising more than +60% from the year's bottom.
Four years later in 2013, which was the 1st year of Obama's 2nd term in office, Dow had again a strong year, rising by +25% (naturally the previous term was more aggressive as the market had tremendous upside potential to recover from one of the worst economic crises in history).
Moving forward again 4 years (2017), we can see yet another bullish (+35%) 1st year of Presidency, this time Trump's first term.
Biden also had his fair share of bullish 1st year of Presidency in 2021 (+23%).
The pattern is evident and shows the euphoria the market has when the U.S. President assumes his duties on his 1st year. It also shows that (excluding as mentioned 2009, which was natural to see a stronger recovery) on average it is fair to expect a price increase during the 1st year of around +25% to +30%.
In fact, the price action that led to the current 1st year of Presidency that has just started (Trump's 2nd term), is very similar to the one that preceded Obama's 2nd term (2013). Both formed a Channel Up after the 1W MA200 (orange trend-line) was tested and held. That pattern pushed the price higher until the 1st year of Presidency, that found the index on the 1W MA50 (blue trend-line). Even the 1W MACD sequences that preceded this, are similar between the two fractals.
As a result, investors have a strong reason to be bullish in 2025 and if pattern achieves the bear minimum of 2021 (+23%), we can expect to see 51000 by the end of the year.
-------------------------------------------------------------------------------
** Please LIKE 👍, FOLLOW ✅, SHARE 🙌 and COMMENT ✍ if you enjoy this idea! Also share your ideas and charts in the comments section below! This is best way to keep it relevant, support us, keep the content here free and allow the idea to reach as many people as possible. **
-------------------------------------------------------------------------------
💸💸💸💸💸💸
👇 👇 👇 👇 👇 👇

DOW JONES: Crossed above the monthly Channel Down. Buy signal.Dow Jones turned bullish again on its 1D technical outlook (RSI = 57.829, MACD = -79.310, ADX = 34.732) as it crossed over the Channel Down that is the bearish wave of the long term bullish trend. The 1W MA50 held and we have to go back to October 30th 2023 to find the last time that the index was under it. If the 1W RSI crosses above the MA trendline, we will confirm that most likely we are going to have a November 6th 2023 type of bullish breakout. The major rallies of the past years have been at least +20%. Buy and TP = 50,500.
See how our prior idea has worked out:
## If you like our free content follow our profile to get more daily ideas. ##
## Comments and likes are greatly appreciated. ##

Weekly Market Forecast Jan 20-24thThis is an outlook for the week of Jan 20-24
In this video, we will analyze the following FX markets:
ES \ S&P 500
NQ | NASDAQ 100
YM | Dow Jones 30
GC |Gold
SiI | Silver
PL | Platinum
HG | Copper
The indices look set to move higher this week, as Trump is inaugurated Monday, bringing a possible "Trump Pump" to the markets. The metals are a bit mixed, but may continue upward this week.
Enjoy!
May profits be upon you.
Leave any questions or comments in the comment section.
I appreciate any feedback from my viewers!
Like and/or subscribe if you want more accurate analysis.
Thank you so much!
Disclaimer:
I do not provide personal investment advice and I am not a qualified licensed investment advisor.
All information found here, including any ideas, opinions, views, predictions, forecasts, commentaries, suggestions, expressed or implied herein, are for informational, entertainment or educational purposes only and should not be construed as personal investment advice. While the information provided is believed to be accurate, it may include errors or inaccuracies.
I will not and cannot be held liable for any actions you take as a result of anything you read here.
Conduct your own due diligence, or consult a licensed financial advisor or broker before making any and all investment decisions. Any investments, trades, speculations, or decisions made on the basis of any information found on this channel, expressed or implied herein, are committed at your own risk, financial or otherwise.

Forecast UPDATES! Jan 15, WedIn this video, we will update the forecasts for the following markets:
ES \ S&P 500
NQ | NASDAQ 100
YM | Dow Jones 30
GC |Gold
SiI | Silver
PL | Platinum
HG | Copper
Enjoy!
May profits be upon you.
Leave any questions or comments in the comment section.
I appreciate any feedback from my viewers!
Like and/or subscribe if you want more accurate analysis.
Thank you so much!
Disclaimer:
I do not provide personal investment advice and I am not a qualified licensed investment advisor.
All information found here, including any ideas, opinions, views, predictions, forecasts, commentaries, suggestions, expressed or implied herein, are for informational, entertainment or educational purposes only and should not be construed as personal investment advice. While the information provided is believed to be accurate, it may include errors or inaccuracies.
I will not and cannot be held liable for any actions you take as a result of anything you read here.
Conduct your own due diligence, or consult a licensed financial advisor or broker before making any and all investment decisions. Any investments, trades, speculations, or decisions made on the basis of any information found on this channel, expressed or implied herein, are committed at your own risk, financial or otherwise.

DOW JONES Falling Wedge to break upwards soon.Dow Jones is trading inside a Falling Wedge.
Right now it is on the MA50 (4h) after rising on a bullish wave to the pattern's top.
The pattern is very close to be completed and Falling Wedges tend to break to the upside once completed.
Trading Plan:
1. Buy on the next pull back.
Targets:
1. 43500 (under the 2.0 Fibonacci extension).
Tips:
1. The RSI (1d) is on higher lows, i.e. a bullish extension since December 18th. Sign that a bullish break out is ahead.
Please like, follow and comment!!
Notes:
Past trading plan:

DOW JONES: contact with the 4 month Support Zone. Strong hold.Dow Jones approached the oversold limit today on its 1D technical outlook (RSI = 38.566, MACD = -404.260, ADX = 33.712) as it hit the S1 Zone, which is in effect since late September 2024. The last test of this Zone (November 4th 2024) also coincided with the 4H RSI getting oversold (under 30.000) and the price was also trading inside a Channel Down. By early next week, we expect the index to initiate a similar rebound, aiming at the 0.786 Fibonacci level (TP = 44,300).
## If you like our free content follow our profile to get more daily ideas. ##
## Comments and likes are greatly appreciated. ##

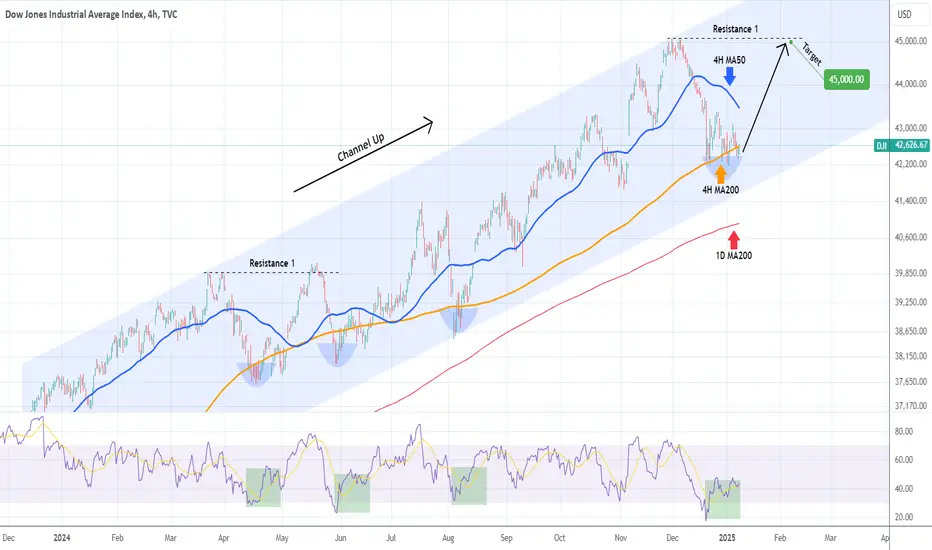
DOW JONES The RSI shows the bottom is in.Dow Jones (DJI) has been trading within a 1-year Channel Up and is on a Bearish Leg since the December 05 2024 High. The price has found support so far 4 times on the 4H MA200 (orange trend-line) and is consolidating.
This is most likely a bottom formation as the 4H RSI is posting a Bullish Divergence similar to the 3 previous times in 2024 when the price broke below the 4H MA200. Technically once the 4H MA50 (blue trend-line) breaks, we should a confirmed Bullish Leg, which is what happened on all 3 occasions.
The minimum Target is Resistance 1 at 45000. Note that as long as the 1D MA200 (red trend-line) holds, the bullish trend will continue to be favored.
-------------------------------------------------------------------------------
** Please LIKE 👍, FOLLOW ✅, SHARE 🙌 and COMMENT ✍ if you enjoy this idea! Also share your ideas and charts in the comments section below! This is best way to keep it relevant, support us, keep the content here free and allow the idea to reach as many people as possible. **
-------------------------------------------------------------------------------
💸💸💸💸💸💸
👇 👇 👇 👇 👇 👇
DOW JONES giving a buy opportunity on this correction.Dow Jones / US30 pulled back today and remains under its 1day MA50 for 20 days straight.
Despite this weakness, this is technically a bottom formation of the Channel Up.
As long as the 1day MA200 holds, the long term trend is bullish.
Technically, it is similar with the Channel's first correction, which also pulled back by almost -7%.
The 1day RSI is printing the same bullish divergence as then, which cause the price to rebound immediately and hit Resistance A.
Buy and target 45000.
Follow us, like the idea and leave a comment below!!

A Bearish Move Imminent for the Dow Jones?My Plan for Tuesday Morning (1/7):
I’m targeting a potential 700+ tick trade. The 400 tick dump back to morning open structure was an eye opener, and with high-impact news scheduled for 9 AM, I’m anticipating it will drive the market further down toward its respected price 42,511 . Let’s see how it plays out!
After chatting with @Dow_Jones_Maestro I’ve realized that my strong bullish idea is likely off the mark, which means the selling pressure might not be over yet. Be sure to check out his most recent idea—it’s packed with valuable insights:

Is the Dow Jones Poised for a Rally?Here’s my plan for Monday morning (1/6): I’m aiming for a solid 6:1 trade. Even with no high-impact news on the horizon, I’m confident price will reach its target regardless.
I believe the selling phase might be over, and we’re now positioning for a significant rally toward the 46,000 level. A glance at the daily chart reveals a bullish formation taking shape, suggesting the potential for a strong upward surge to new heights:
Let’s see how this unfolds this week—time to lock in and rack up those ticks!

Will Dow Jones repeat itself? | Bullish Action Idea for 1/3While conducting my evening analysis, I noticed that the last time price reached 42,510, it pumped over 1,000 ticks during the morning open. This occurred on Friday, December 20th.
Looking at the current hourly chart, price action seems to be forming a similar concept. This leads me to believe we should touch 42,510 by morning open and then push toward buy-side liquidity around 43,097 and beyond. If this plays out as anticipated, I’m aiming to secure around 600 ticks.
We do have PMI at 9, so hopefully its high impact will drive us further through buy-side.
Trying to get better at predicting bullish price action, so lets hope this plays out.
Let's collect these ticks!

DOW JONES: Rare Channel Up bottom buy opportunityDow Jones remains bearish on its 1D technical outlook (RSI = 40.772, MACD = -242.050, ADX = 47.872) as despite trading on the 1D MA100, it has failed yet to recover the 1D MA50. Technically though, the price action is sitting exactly at the bottom of the long term Channel Up and the 1D RSI has formed a bottom fractal identical to those of June and April 2024. The minimum target on those has been +7.65% but since we have the R1 level to consider as Resistance, that will be our target (TP = 45,000).
## If you like our free content follow our profile to get more daily ideas. ##
## Comments and likes are greatly appreciated. ##

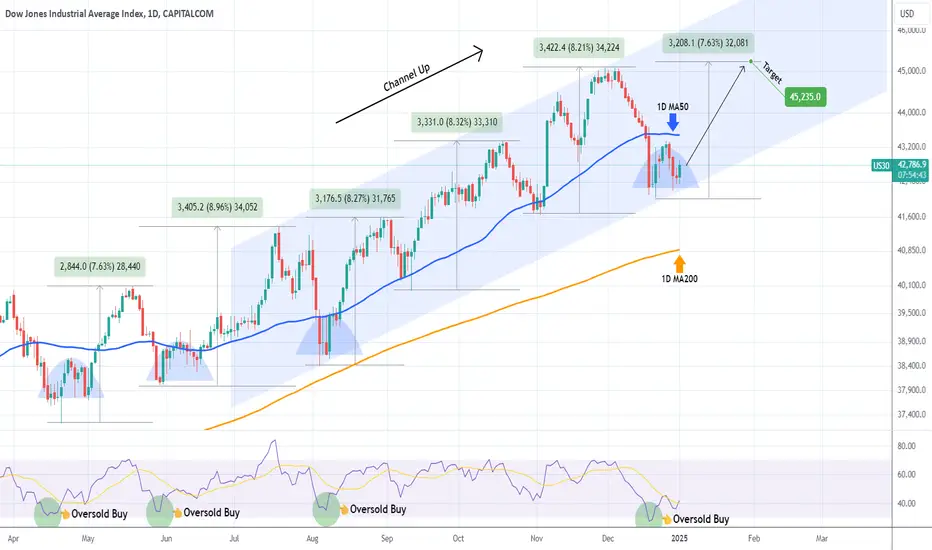
DOW JONES Bullish accumulation below the 1D MA50.Dow Jones (DJI) has been trading within a Channel Up since the July 18 High. Right now the price is consolidating between its bottom (Higher Lows trend-line) and the 1D MA50 (blue trend-line). At the same time, the 1D RSI breached the oversold barrier (30.00) and rebounded.
This trading sequence has presented the most efficient buy opportunity since April 19 2024 and the even though all Bullish Legs that followed have been a little over +8.00%, the weakest one has been +7.63%. As a result, our current Bullish Leg Target of 45235 is formulated out of that minimum.
-------------------------------------------------------------------------------
** Please LIKE 👍, FOLLOW ✅, SHARE 🙌 and COMMENT ✍ if you enjoy this idea! Also share your ideas and charts in the comments section below! This is best way to keep it relevant, support us, keep the content here free and allow the idea to reach as many people as possible. **
-------------------------------------------------------------------------------
💸💸💸💸💸💸
👇 👇 👇 👇 👇 👇
Elliott Wave View: Dow Futures (YM) Looking for Double CorrectioShort Term Elliott Wave view of Dow Futures (YM) is looking for a larger degree correction against cycle from 3.15.2023 low in 3, 7, or 11 swing. Rally to 45183 ended cycle from 3.15.2023 low as wave ((3)) per 1 hour chart below. Wave ((4)) pullback is now in progress to correct that cycle. Internal subdivision of wave ((4)) is unfolding as a double three Elliott Wave structure. Down from wave ((3)), wave A ended at 43941 and wave B rally ended at 44556. Wave C lower ended at 42496 which completed wave (W) in higher degree.
Rally in wave (X) unfolded as a zigzag Elliott Wave structure. Up from wave (W), wave A ended at 43663 and wave B ended at 42928. Wave C higher ended at 43746 which completed wave (X). The Index has turned lower in wave (Y), but it still needs to break below wave (W) at 42496 to validate this view. Near term, as far as pivot at 45183 high stays intact, expect the Index to extend lower. Potential target for wave (Y) lower is 100% – 161.8% Fibonacci extension of wave (W). This area comes at 39403 – 41060 area where buyers can appear for more upside or 3 waves rally at least.

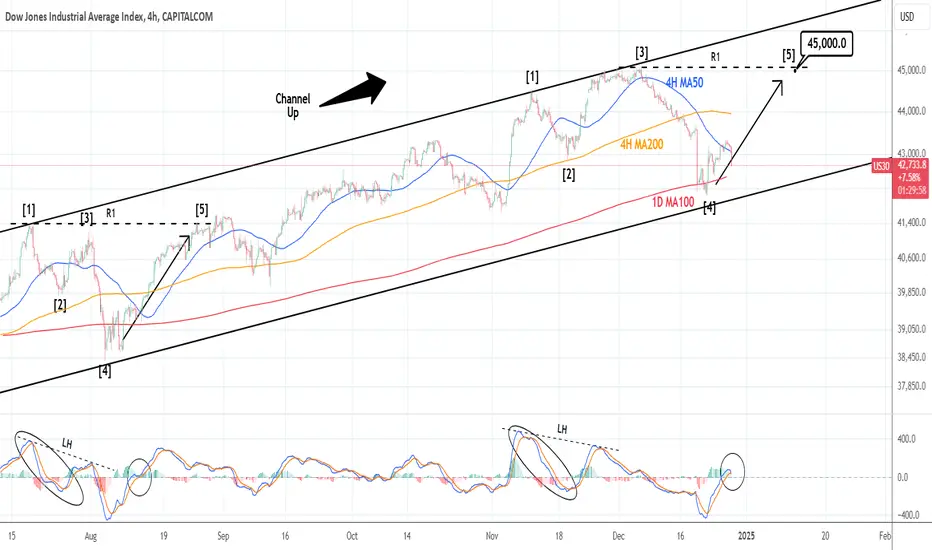
DOW JONES: Ignore the pullback, this is a new bullish wave.Dow Jones turned bearish again on its 1D technical outlook (RSI = 41.280, MACD = -138.420, ADX = 33.278) as it failed to hold the 4H MA50 as support today and crossed under it. The 1D MA100 is coming in as the next level of support, which formed the Dec 18th-19th low. According to the 4H MACD, the index formed during those 2 days a bottom similar to of August 5th. As long as the 1D MA100 holds, it is more likely to see a bounce above the 4H MA50 again like August 13th. Our goal is a wave, so we're targeting the R1 level (TP = 45,000).
## If you like our free content follow our profile to get more daily ideas. ##
## Comments and likes are greatly appreciated. ##
DOW JONES What signals the top of this Cycle?Dow Jones (DJI) has been on a highly systematic pattern ever since the 2009 bottom of the U.S. Housing Crisis and this chart on the 3W time-frame depicts very accurately the symmetrical nature of the Cycles that the index is going through in the past 15 years.
As you see, ever since the October 2011 bounce on both the 3W MA50 (blue trend-line) and 3W MA200 (orange trend-line), Dow started a hyper aggressive Bull Cycle, which after making a Top on each phase, it broke below the 3W MA50 to become a buy opportunity again but has never yet broken below the 3W MA200.
So far we have completed three such phases and we are currently on the 4th. In the three that have already been completed, the Top of the Phase was signaled by the RSI. At a certain point that it broke above the 70.00 overbought barrier, it started a Channel Down comprised of 4 legs (a through d). On the (d) leg, it gave a signal that Dow had (or is very close to) topped. That was the ultimate long-term Sell Signal. Similarly, when the index broke below its MA50 and the RSI double bottomed, it has been the ultimate signal to buy.
Right now it appears that the RSI has completed Leg (a) and is starting the rise to Leg (b) of its newly emerged Channel Down. That means that the market has around another 12 months before it Tops again.
-------------------------------------------------------------------------------
** Please LIKE 👍, FOLLOW ✅, SHARE 🙌 and COMMENT ✍ if you enjoy this idea! Also share your ideas and charts in the comments section below! This is best way to keep it relevant, support us, keep the content here free and allow the idea to reach as many people as possible. **
-------------------------------------------------------------------------------
💸💸💸💸💸💸
👇 👇 👇 👇 👇 👇

DOW JONES: 5 month Channel Up bottomed and 1D MA100 hit. BullishDow Jones turned bearish on its 1D technical outlook (RSI = 35.675, MACD = -65.830, ADX = 38.532) after yesterday's sharp drop due to the Fed announcing an outlook shift to 2 rate cuts in 2025 from 4 previously. Technically though that fall presents a unique long term buy opportunity as despite crossing under the 1D MA50, it managed to hit the 1D MA100 for the first time since Aug 8th while touching the bottom of the 5 month Channel Up. Today the price is showing the first signs of rebounding. The 1D RSI rebounding from below 30.000 (oversold) is also a great bullish indicator. The drop that resembles most December's is the first bearish wave of the Channel (July-August). When it recovered, the rebound hit the R1 level at first and that is our target (TP = 45,000).
## If you like our free content follow our profile to get more daily ideas. ##
## Comments and likes are greatly appreciated. ##

DOW JONES 13-year pattern that never failed eyes $48000.Dow Jones (DJI) gave us the best bullish break-out signal exactly 1 year ago (December 13 2023, see chart below), as our buy entry at 36577 hit our 42900 long-term Target last October:
At that time we made a clear point why that rally 'shouldn't surprise you' and it is because of this pattern's consistency for so many years. This 1W time-frame chart shows the cyclical behavior of the index, which peaks (Sine Wave top), then pulls back and starts forming a Rising Wedge (Sine Wave bottom) and when it breaks above the Rising Wedge, is where it flashed the bullish break-out signal we got a year ago.
As you can see it then starts a gradual rise on the BB20 and completes the Cycle again (Sine Wave top) after roughly a +47% rally. The title mentions that this pattern 'never failed', practically it only broke during the COVID flash crash, which was a non-technical event than occurs once every 100 years. As you can see even the 1W MACD sequences between the cyclical patterns are identical.
As a result, our Target towards the Sine Wave peak is 48000. If this is achieved in Q2 2025, based on Dow's current Channel Up (dashed), then we expect the index to remain on those high levels but turn more neutral sideways towards the end of 2025 and then eventual start of the new Bear Phase.
-------------------------------------------------------------------------------
** Please LIKE 👍, FOLLOW ✅, SHARE 🙌 and COMMENT ✍ if you enjoy this idea! Also share your ideas and charts in the comments section below! This is best way to keep it relevant, support us, keep the content here free and allow the idea to reach as many people as possible. **
-------------------------------------------------------------------------------
💸💸💸💸💸💸
👇 👇 👇 👇 👇 👇

Dow Jones Bearish Price Action Gameplan for 12/16High-impact news should bring significant volume on Monday. Based on this, I anticipate a strong buy from 5:00 AM to 8:30 AM CST, potentially pushing price back up to FOMC Support before resuming its bearish trend toward 43,575 —a move worth approximately 358 ticks. If the market grants me my desired volume, I may be tempted to surf a few concepts; however, after Friday's successful hold, I’m leaning toward placing my sell position and holding it for the remainder of the session.
I anticipate price selling down to 43,300 by Wednesday FOMC, as this level aligns with the overall bullish trend we're currently in. Dow Jones often respects structures and trends, so I’m banking on it continuing to do so.
My only concern is that the election candle drove the trend higher than the original bull trend, so we may or may not reach my anticipated target. @Dow_Jones_Maestro posted a perfect example of this, check out his idea linked below:
Let’s lock in and collect those ticks!

Weekly Forex Forecast: Buy The S&P & NASDAQ. Wait On The DOW!This forecast is for the week of DEC 16 - 20th.
The SP500 & NAS100 are bullish and buys are the order for the week. The DOW Jones is weeker, sliding down as the USD climbs. Be careful here, as the DOW tends to travel it's own path at times.
FOMC is Wednesday. Stay vigilant and disciplined this week!
Check the comments section below for updates regarding this analysis throughout the week.
Enjoy!
May profits be upon you.
Leave any questions or comments in the comment section.
I appreciate any feedback from my viewers!
Like and/or subscribe if you want more accurate analysis.
Thank you so much!
Disclaimer:
I do not provide personal investment advice and I am not a qualified licensed investment advisor.
All information found here, including any ideas, opinions, views, predictions, forecasts, commentaries, suggestions, expressed or implied herein, are for informational, entertainment or educational purposes only and should not be construed as personal investment advice. While the information provided is believed to be accurate, it may include errors or inaccuracies.
I will not and cannot be held liable for any actions you take as a result of anything you read here.
Conduct your own due diligence, or consult a licensed financial advisor or broker before making any and all investment decisions. Any investments, trades, speculations, or decisions made on the basis of any information found on this channel, expressed or implied herein, are committed at your own risk, financial or otherwise.

DOW JONES: Neutral 1D means buy opportunity.Dow Jones is neutral on its 1D technical outlook (RSI = 53.536, MACD = 330.150, ADX = 20.923) as it is on the bearish wave of the 4H Channel Up, towards the 4H MA200, which on November 19th priced the last HL. The 4H RSI got oversold and rebounded today above its MA period, which twice before has been a buy signal. We are going long here, aiming at the 1.382 Fibonacci extension (TP = 45,400).
See how our prior idea has worked out:
## If you like our free content follow our profile to get more daily ideas. ##
## Comments and likes are greatly appreciated. ##

12/11 NQ & YM Market AnalysisMarket Insight: Bears in Control, Detox in Progress
Today's market sentiment mirrors yesterday’s, with bears continuing to dominate. Traders should respect the bearish trend and prioritize short-selling strategies.
🔻 Bearish Strategy Insight:
The market needs to release recent pressure to achieve optimal "detox" effects. Only after a sufficient correction can the market stabilize, setting the stage for potential bullish attempts later.
🔺 Bullish Opportunity Watch:
While bears maintain control, conservative traders are advised to stay on the sidelines. If bearish momentum weakens after pressure release, bulls may seize the opportunity to challenge the life line levels. These levels will serve as critical resistance points for any upward attempts.
📌 Trading Suggestions:
Short-Term Bearish Bias: Follow the trend, avoid counter-trend trades.
Bullish Entry Timing: Wait for bearish momentum to fade before considering long positions cautiously.
⚠️ Disclaimer: This analysis is for reference only and not investment advice.
Follow us for more real-time market insights! 📈
