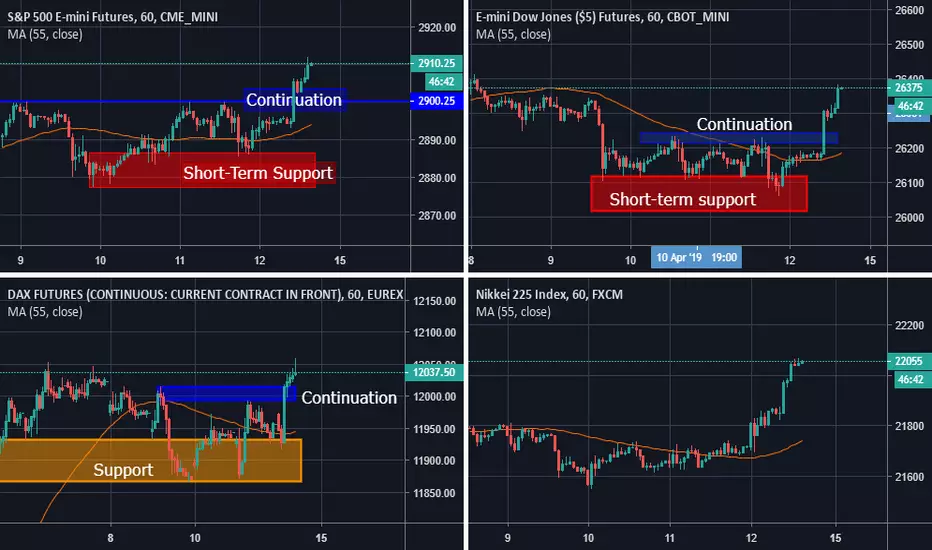
Dow Jones - Continuation Breakout Setup ahead of FOMCStocks received a boost from the more positive wave of
headlines relating to a US-China trade deal. This led to a big
push in the equities markets, before things settled down.
Ranges are likely to hold before tonight's FOMC decision.
The trend is up and continuation breaks are favoured
if we get the dovish FOMC that everyone expects.
Trade AFTER the event - not before.
YM1

Elliott Wave View: Dow Jones Futures Correction to Find BuyersElliott wave view in Dow Jones Futures (YM_F) suggests that the decline to 24604 ended wave ((W)) on June 3. This decline ended the cycle from May 1 high as a 3 waves zigzag Elliott Wave structure. Wave ((X)) bounce is currently in progress to correct the cycle from May 1 high in 3, 7, or 11 swing. The internal of wave ((X)) rally is unfolding as a zigzag Elliott Wave structure. A zigzag is an ABC with 5-3-5 structure. Wave (A) of ((X)) is now in progress as a 5 waves impulse.
Up from 24604, wave 1 ended at 24938 and wave 2 pullback ended at 24684. Rally then resumes in wave 3 to 26085, wave 4 ended at 25974, and wave 5 ended at 26289. The 5 waves move higher ended wave (A) of higher degree. Short term, Index is in wave B pullback to correct cycle from June 3 low (24604) in 3, 7, or 11 swing before turning higher again in wave (C). We don’t like selling the Index. As the rally from June 3 low is impulsive, expect wave (B) pullback to hold above 24604 for at least 1 more push higher in wave (C).

Dow Jones - Risk-Off Returning, Shorts Favoured!Risk appetite is once again sour after Trump tweeted
and a Washington Post interview fuelled concerns over
political pressure on the Fed and trade woes anew.
The US President first tweeted that the US is put at a
‘big disadvantage’ as US rates are kept too high while
others are devaluing their currencies, explicitly
mentioning the EUR and CNY.
Separately, Trump said that he is currently ‘holding up’
the deal between the US and China on trade, accusing
China of reneging on previously agreed terms.
We believe there is more pain in store for equities today,
and would sell the Dow here near resistance.

POC to VAH on DJIThis chart shows the balance zone and bell curve that has been created in the volume profile since Jan 18. This week price fell to the 18 month Point of Control and was immediately bought up to the Value Area high, forming a bullish engulfing candle as it did so.
In terms of trading from here, any buying above this level is now buying out of value. Shorting at this level or higher is good value if looking for a responsive move lower, but not without an entry signal. Remember this is a longer term chart and the daily profiles are showing value moving higher every day last week.
The profile also has a positive skew, in that there is much more action above the POC than below. This is people buying at higher prices as they believe that in the longer term they are buying value- bullish overall.


Dow Jones might be finding support along green trend lineThe Green trend line has acted as a good support since the mid point of last year. This may be a bottom of a upward channel forming.

Elliott Wave View: Dow Jones Future YM_F Rally Should FailShort term Elliott Wave view on Dow Jones Future (YM_F) calls for the bounce to 25952 as wave (B). This move higher is a correction to the decline from April 24, 2019 peak.
In order to avoid a double correction in wave (B) and provide validity to this view, Dow Jones Future needs to break below wave ((i)) at 25215. However, technical analysis on US Sectors such as Financial (XLF), Technology (XLK), Consumer Discretionary (XLY) suggest they have broken lower. Thus, we think it’s likely that Dow Jones Futures also extends lower.
Therefore, we don’t like buying the Index and expect sellers to appear in 3, 7, or 11 swing as far as pivot at 25952 peak stays intact.

VWAP, Volume profile and pivots combined for day tradingAs annotated on the chart, weekly pivots combined with volume profile and VWAP bands can give high % entries.
me
On responsive days, VWAP bands give accurate points of entry for a move back to the current VWAP or POC.
Be wise to the the of day that is developing, and use the appropriate strategy. For example on trend days do not play for responsive moves as you'll get run over. Neutral/balancing/normal days buy or sell out of value for a return to value using VWAP and pivots as a guide. Stops should be placed above or below pivots or the next VWAP band (2.5 or 3 SD).
For further accuracy use the bigger picture- market and volume profile of the last few days.

VWAP and volume profile combined with pivots for day tradingAs annotated on the chart, weekly pivots combined with volume profile and VWAP bands can give high % entries.
On responsive days, VWAP bands give accurate points of entry for a move back to the current VWAP or POC.
Be wise to the the of day that is developing, and use the appropriate strategy. For example on trend days do not play for responsive moves as you'll get run over. Neutral/balancing/normal days buy or sell out of value for a return to value using VWAP and pivots as a guide. Stops should be placed above or below pivots or the next VWAP band (2.5 or 3 SD).
For further accuracy use the bigger picture- market and volume profile of the last few days.

Dow Jones - Risk-Off Dissipates but Downtrend IntactThe Fed's dovish shift in 2019 that pushed prices higher has been overshadowed by ramped up tension on the global trade front. This should continue to be a drag on investor sentiment until other factors prevail.
Our bias remains down on the Dow, as highlighted by the 55 SMA Slope and the fact we have not yet broken key resistance areas.
It will be tricky today. Consider adding on continuation shorts intraday with caution.

Dow Jones - Downtrend Intact, Consider AddingDow Jones remains the weakest US index and is in a downtrend as highlighted by the 55 SMA slope.
The downtrend is generated by the US/China trade war issues. Headline risk is present.
We favour further downside through the continuation level.

Dow Jones - Downtrend Intact, Consider AddingDow Jones is the weakest US index.
Trend is down as highlighted by the key daily level break and the 55 SMA Slope.
Everyhing hinges on US/China trade talks so we would wait until the US Cash Open
before trading and would prefer a continuation break on bad news.

Dow Jones - Patience RequiredDirectional movement is stalled currently, as highlighted by the lateral 55 SMA.
We need a break of either the short-term support or short-term resistance in order to start
trending movement again.
Patience is required for now.

Dow Jones - Downtrend in PlayThe long bias was flipped by President Trump's new escalation of the US/China Trade War.
Whether it is a bluff or not is yet to be seen. For now, charts point lower.
Short-term resistance and continuation levels highlighted.

Dow Jones - Uptrend Fading, Short-Term Bias is DownChallenging action to trade, especially ahead of Non-Farm Payrolls. However, momentum remains to the downside for now.
Short-term resistance and continuation levels highlighted.

Dow Jones - Uptrend Stalled, Short-Term Momentum NegativeYesterday's negative close ocnfirms our short-term bearish bias. Short-term resistance and continuation levels highlighted.

Dow Jones - Uptrend Weakening, Short-Term Shorts in PlayIt seems significant that the Dow is now negative on the week after pushing to new highs.
We see this as possible short-term shift in sentiment and we favour short-term shorts for the time being.

Dow Jones - Uptrend Stalled. Bias is Neutral.Short-term Support still holding. No trading on this instrument at the moment.

Dow Jones - Uptrend IntactShort term support and continuation levels highlighted. Be aware that equities failed to rally on good news from China today. This is a signal of caution.

Indices - Risk On is the Theme of the DayNice moves in Indices but beware of earnings from US banks today: JPMorgan and Wells Fargo will be watched closely for signs of economic slowdown or recession.
US Exhaustion on Main resistance Double Top H4I m shorting this level if prices fail to break 25.260-300 which seems to act as a strong resistance for now.
Trade FXCM CFD Entry: 26.290 - TP1: 26125 - TP2 26860 - sl:25340


#FXinsights #cisTOPIX US$ & Real Capital Gains in MarketsFrom NEW BOOK "P.R.O Trading" by Joshua Corum in CORUM's Capitalism Theorem (+BONUS Chapter) DJIA TVC:DJI at $17420 will accumulate $6.7 TRILLION in $USD Real Capital Gains and Increase the USD$ TVC:DXY to 6.7% to 102.96 where REAL Capital Risk + Costs is ONLY 1.34%. U.S. Markets need to take these capital gains NOW!
RIGHT NOW REAL US$ Capital Risk + Costs = 5.36%
THIS is 5.36 PIPS per $100,000 lot in Capital Structures!!! TOO HIGH!!!
See #FXinsights & #cisTOPIX ONLINE!!!
