Market Forecast UPDATES! Monday, Mar 3rdIn this video, we will update the forecasts posted last March 2nd for the following markets:
ES \ S&P 500
NQ | NASDAQ 100
YM | Dow Jones 30
GC |Gold
SiI | Silver
PL | Platinum
HG | Copper
Enjoy!
May profits be upon you.
Leave any questions or comments in the comment section.
I appreciate any feedback from my viewers!
Like and/or subscribe if you want more accurate analysis.
Thank you so much!
Disclaimer:
I do not provide personal investment advice and I am not a qualified licensed investment advisor.
All information found here, including any ideas, opinions, views, predictions, forecasts, commentaries, suggestions, expressed or implied herein, are for informational, entertainment or educational purposes only and should not be construed as personal investment advice. While the information provided is believed to be accurate, it may include errors or inaccuracies.
I will not and cannot be held liable for any actions you take as a result of anything you read here.
Conduct your own due diligence, or consult a licensed financial advisor or broker before making any and all investment decisions. Any investments, trades, speculations, or decisions made on the basis of any information found on this channel, expressed or implied herein, are committed at your own risk, financial or otherwise.
YM1

DOW JONES MA200 (1d) test on the Channel Up bottom. BULLISH.Dow Jones is trading inside a Channel Up but lately finds itself on a pull back.
This pull back is about to test the MA200 (1d) at the bottom of the pattern.
The MA200 (1d) has been holding as Support since November 3rd 2023, so overall that makes it a buy opportunity.
Trading Plan:
1. Buy on the current market price.
Targets:
1. 46400 (the 1.382 Fibonacci extension).
Tips:
1. The RSI (1d) is almost oversold and at 35.00 it has turned sideways. Every time the RSI was on this level or belowsince October 2023, it was the best buy opportunity.
Please like, follow and comment!!

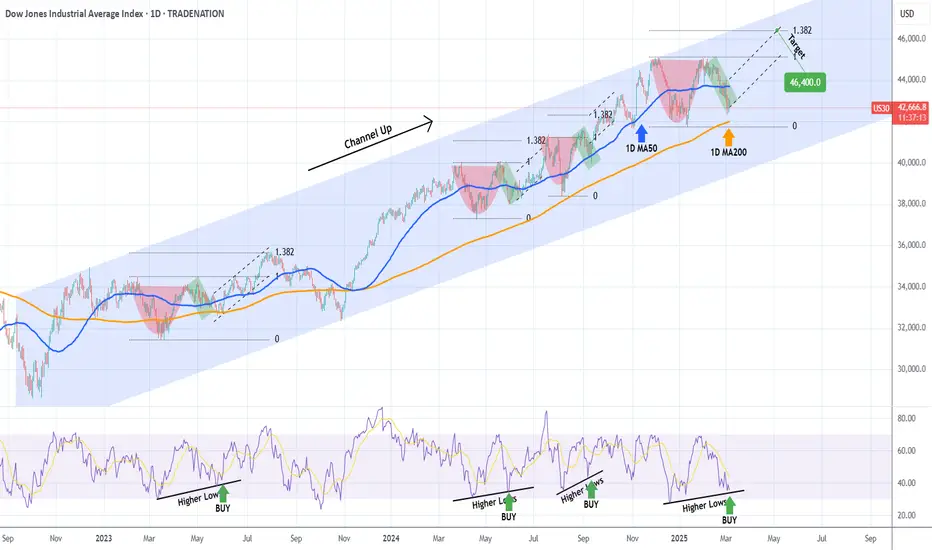
DOW JONES Massive 1D MA200 reversal for Cup and Handle?Dow Jones (DJIA) has been trading within a Channel Up since the September 2022 market bottom. Throughout this long-term structure, Cup and Handle (C&H) patterns have emerged that were always contained above the 1D MA200 (orange trend-line) and subsequently initiated a rebound to at least the 1.382 Fibonacci extension before the next pull-back.
The 1D MA200 is right below us at the moment and the current C&H seems to be on the verge of completing its Handle. Moreover, the 1D RSI is on its usual Higher Lows trend-line that prompts to a the most optimal buy entry. We're bullish, targeting 46400 (the 1.382 Fibonacci extension).
-------------------------------------------------------------------------------
** Please LIKE 👍, FOLLOW ✅, SHARE 🙌 and COMMENT ✍ if you enjoy this idea! Also share your ideas and charts in the comments section below! This is best way to keep it relevant, support us, keep the content here free and allow the idea to reach as many people as possible. **
-------------------------------------------------------------------------------
Disclosure: I am part of Trade Nation's Influencer program and receive a monthly fee for using their TradingView charts in my analysis.
💸💸💸💸💸💸
👇 👇 👇 👇 👇 👇
Will Dow Jones Extend Its Selloff?I believe Dow Jones still has more downside ahead. I anticipate a break below 42,200 tomorrow morning, potentially taking out more of January’s lows.
If price rises overnight, I’ll be looking for a Short position at the 8:30 CST open. If it doesn’t, I’ll likely go Long toward the dump initiation zone around 43,160 .
Alternatively, we could potentially begin the sell from 2025 Open Price.
Only time will tell—let’s lock in⚡

Weekly Market Forecast Mar 3-7: Stock Indices, Gold, Oil, moreThis is a FUTURES market outlook for the week of Mar 3-7th.
In this video, we will analyze the following futures markets:
ES | S&P 500
NQ | NASDAQ 100
YM | Dow Jones 30
GC | Gold
SIL | Silver
PL | Platinum
HG | Copper
The indices took a bearish turn at the end of last week. Trump announcements, tariffs, Ukraine and Russia injected uncertainty into the markets, and investors moved money into safe havens.
Patience is required to trade in this environment. Wait until there are clear signs of shifts in the market before deciding on a bias. Setup confirmations are always the best course of action.
Enjoy!
May profits be upon you.
Leave any questions or comments in the comment section.
I appreciate any feedback from my viewers!
Like and/or subscribe if you want more accurate analysis.
Thank you so much!
Disclaimer:
I do not provide personal investment advice and I am not a qualified licensed investment advisor.
All information found here, including any ideas, opinions, views, predictions, forecasts, commentaries, suggestions, expressed or implied herein, are for informational, entertainment or educational purposes only and should not be construed as personal investment advice. While the information provided is believed to be accurate, it may include errors or inaccuracies.
I will not and cannot be held liable for any actions you take as a result of anything you read here.
Conduct your own due diligence, or consult a licensed financial advisor or broker before making any and all investment decisions. Any investments, trades, speculations, or decisions made on the basis of any information found on this channel, expressed or implied herein, are committed at your own risk, financial or otherwise.

Where is the Indices going and Bitcoin? This is my opinion of what I think will happen in March after February sell off. I have bullish bias for both indices and Bitcoin as long as 80K Level stays intact in case of BTC.
Also RSI and Volume divergence can be seen for extra confirmation
Disclaimer: Not a financial advice. Do your own analysis

Dow Jones Bullish Setup for a Friday Dump?We've swept today's lows while also establishing a new high. This sets the stage for a strong buyback toward the 44,000 level, where we previously dumped last Friday. I am eyeing the areas around 43,470 & 43,562 as potential opening structures.
With high-impact news closing out both the week and the month, we should see some solid volatility—presenting prime opportunities to capitalize on market moves. Let’s lock in⚡
Its too early to tell, but I am anticipating a crazy dump on Friday that will take us back to 2025 Open price.

DOW JONES Cup and Handle completed and eyes a new ATH.Dow Jones (DJIA) has been trading within a Channel Up since the October 2022 market bottom of the Inflation Crisis. Inside this pattern, four Cup and Handle (C&H) formations have occurred with the most recent one, about to complete its Handle this week.
All such C&H patterns, rebounded to at least the 1.382 Fibonacci extension before the next pull-back. As a result, our Target before May remains 46400.
-------------------------------------------------------------------------------
** Please LIKE 👍, FOLLOW ✅, SHARE 🙌 and COMMENT ✍ if you enjoy this idea! Also share your ideas and charts in the comments section below! This is best way to keep it relevant, support us, keep the content here free and allow the idea to reach as many people as possible. **
-------------------------------------------------------------------------------
💸💸💸💸💸💸
👇 👇 👇 👇 👇 👇

DOW JONES Bull Flag completed. Massive rally ahead.Dow Jones / US30 has completed a Channel Down on the 0.5 Fibonacci retracement level.
This pattern is nothing more than a Bull Flag based on September's similar structure that also hit the 0.5 Fib and 1day MA50 and bottomed.
This time, the 1day RSI is also on a Rising Support.
Both corrections took place after a +8.15% rise and September's then went on to rebound to the 1.5 Fib extension.
Buy and target 46700.
Follow us, like the idea and leave a comment below!!

Dow Jones Bullish Pullback 2/25I'm looking to take a Long position at the 8:30 AM open tomorrow. I've drawn out two key setups that would confirm my bullish outlook above.
Ideally, we open within the 43,505 - 43,575 range, setting up a strong buying opportunity.
The Daily formed a nice doji candle to close out Monday, so I am really confident that we will see some nice bullish action tomorrow morning.
Just throwing ideas out there, I won't really know anything for certain until around 7am.
Lets collect these ticks⚡

Weekly Market Forecast Feb 24-28: SPX, NAS, DJI, GOLD, ...This is a FUTURES market outlook for the week of Feb 17-21st.
In this video, we will analyze the following futures markets:
ES | S&P 500
NQ | NASDAQ 100
YM | Dow Jones 30
GC | Gold
SIL | Silver
PL | Platinum
HG | Copper
The USD continues its bearish ways this upcoming weak. It's currency counterparts will likely see some upside this week. Especially the JPY.
Patience and an ear to the news will be the best way to approach the equity markets. The same would also apply to news sensitive commodity markets like US OIL, Gold and Silver.
Enjoy!
May profits be upon you.
Leave any questions or comments in the comment section.
I appreciate any feedback from my viewers!
Like and/or subscribe if you want more accurate analysis.
Thank you so much!
Disclaimer:
I do not provide personal investment advice and I am not a qualified licensed investment advisor.
All information found here, including any ideas, opinions, views, predictions, forecasts, commentaries, suggestions, expressed or implied herein, are for informational, entertainment or educational purposes only and should not be construed as personal investment advice. While the information provided is believed to be accurate, it may include errors or inaccuracies.
I will not and cannot be held liable for any actions you take as a result of anything you read here.
Conduct your own due diligence, or consult a licensed financial advisor or broker before making any and all investment decisions. Any investments, trades, speculations, or decisions made on the basis of any information found on this channel, expressed or implied herein, are committed at your own risk, financial or otherwise.

DOW JONES Rectangle bottom formed. Bullish.Dow Jones hit today its MA200 (4h) and rebounded.
This has come too close to the bottom of the Rectangle pattern that dominates the price action in the past 3 weeks.
Trading Plan:
1. Buy on the current market price.
2. Buy again if the price closes above the Falling Resistance.
Targets:
1. 44450 (MA50 4h and Falling Resistance).
2. 45000 (top of Rectangle).
Tips:
1. The RSI (4h) got oversold and rebounded like on the February 3rd Low. Strong buy signal.
Please like, follow and comment!!

DOW JONES 1D MA50 supporting huge Inverse H&S push!Dow Jones (DJIA) has been trading within a Channel Up for the past 15 months. The pattern that could be the strongest driving force however in the coming weeks is an Inverse Head and Shoulders (IH&S), which is about to complete its Right Shoulder.
As you can see this is being strongly supported by the 1D MA50 (blue trend-line) in the past 30 days and every such IH&S pattern in the last 2 years broke to the upside and hit at least its 1.382 Fibonacci extension.
The 1D RSI sequences between those IH&S fractals are identical and the current RSI Bearish Divergence matches perfectly all previous Right Shoulder formations that preceded the 1.382 Fib push.
As a result, a 46400 Target would be an ideal technical Higher High for the Channel Up.
-------------------------------------------------------------------------------
** Please LIKE 👍, FOLLOW ✅, SHARE 🙌 and COMMENT ✍ if you enjoy this idea! Also share your ideas and charts in the comments section below! This is best way to keep it relevant, support us, keep the content here free and allow the idea to reach as many people as possible. **
-------------------------------------------------------------------------------
Disclosure: I am part of Trade Nation's Influencer program and receive a monthly fee for using their TradingView charts in my analysis.
💸💸💸💸💸💸
👇 👇 👇 👇 👇 👇

Weekly Market Forecast Feb 17-21stThis is an outlook for the week of Feb 17-21st.
In this video, we will analyze the following FX markets:
ES \ S&P 500
NQ | NASDAQ 100
YM | Dow Jones 30
GC |Gold
SiI | Silver
PL | Platinum
HG | Copper
FOMC on Wednesday. The news could impact the direction of the USD Index, so be mindful of it. The markets had a relatively bullish week. Trumps reciprocal tariffs study announcement eased some of the tension in the markets also allowed equities to run higher.
The metals saw a bearish turn at the end of the week, but caution should be taken if considering shorting these markets. The overall bullish trend is still in tact.
Enjoy!
May profits be upon you.
Leave any questions or comments in the comment section.
I appreciate any feedback from my viewers!
Like and/or subscribe if you want more accurate analysis.
Thank you so much!
Disclaimer:
I do not provide personal investment advice and I am not a qualified licensed investment advisor.
All information found here, including any ideas, opinions, views, predictions, forecasts, commentaries, suggestions, expressed or implied herein, are for informational, entertainment or educational purposes only and should not be construed as personal investment advice. While the information provided is believed to be accurate, it may include errors or inaccuracies.
I will not and cannot be held liable for any actions you take as a result of anything you read here.
Conduct your own due diligence, or consult a licensed financial advisor or broker before making any and all investment decisions. Any investments, trades, speculations, or decisions made on the basis of any information found on this channel, expressed or implied herein, are committed at your own risk, financial or otherwise.

DOW JONES is completing a Bull Flag to jump to 46700.Dow Jones / US30 is posting a Bull Flag pattern on the 4hour timeframe, currently between the 4hour MA50 and MA200.
The last time we came across this pattern was with the early September Bull Flag.
Both patterns started after a +8.20% rise on the index.
If the new one repeats September's, then we should see an immediate rally to the 1.5 Fibonacci.
Buy and target 46700.
Follow us, like the idea and leave a comment below!!

DOW JONES One last drop below the 1D MA50 is possibleDow Jones (DJIA) has found itself in an uncomfortable spot as it's been trading sideways within the 1D MA50 (blue trend-line) and Resistance 1 of the December 2024 High, for the past two weeks.
The 1D RSI has already started trending downwards on a Bearish Divergence while the 1D MACD just completed a Bearish Cross. The times we've seen all those conditions fulfilled within the 2-year Channel Up, are in mid-May 2024 and early May 2023.
On both occasions, the price got rejected on Resistance 1 and pulled back below the 1D MA50 to form a Higher Low. After the 1D MACD formed a Bullish Cross, the price confirmed a technical reversal and targeted the 1.5 Fibonacci extension before the next pull-back.
As a result, you might want to keep a buy order waiting for a sub-MA50 drop and buy once a MACD Bullish Cross is formed to target 46500 (Fib 1.5 ext).
-------------------------------------------------------------------------------
** Please LIKE 👍, FOLLOW ✅, SHARE 🙌 and COMMENT ✍ if you enjoy this idea! Also share your ideas and charts in the comments section below! This is best way to keep it relevant, support us, keep the content here free and allow the idea to reach as many people as possible. **
-------------------------------------------------------------------------------
💸💸💸💸💸💸
👇 👇 👇 👇 👇 👇

DOW JONES: Necessary correction to lated target 46,600.Dow Jones is neutral on its 1D technical outlook (RSI = 53.301, MACD = 170.540, ADX = 30.319) as it is trading sideways on top of the 1D MA50 for the past 2 weeks. The long term pattern is a Channel Up that every time it rebounded on a HL bottom and hit the R1, it always pulled back again to test the 1D MA50. Consequently, this is a necessary technical correction that will allow the index to attract enough buying momentum again to go after a new HH. Aim for a minimum +8.41% increase (TP = 46,600).
## If you like our free content follow our profile to get more daily ideas. ##
## Comments and likes are greatly appreciated. ##

Market Forecast UPDATES! Tuesday, Feb 11In this video, we will update the forecasts for the following markets:
ES \ S&P 500
NQ | NASDAQ 100
YM | Dow Jones 30
GC |Gold
SiI | Silver
PL | Platinum
HG | Copper
Enjoy!
May profits be upon you.
Leave any questions or comments in the comment section.
I appreciate any feedback from my viewers!
Like and/or subscribe if you want more accurate analysis.
Thank you so much!
Disclaimer:
I do not provide personal investment advice and I am not a qualified licensed investment advisor.
All information found here, including any ideas, opinions, views, predictions, forecasts, commentaries, suggestions, expressed or implied herein, are for informational, entertainment or educational purposes only and should not be construed as personal investment advice. While the information provided is believed to be accurate, it may include errors or inaccuracies.
I will not and cannot be held liable for any actions you take as a result of anything you read here.
Conduct your own due diligence, or consult a licensed financial advisor or broker before making any and all investment decisions. Any investments, trades, speculations, or decisions made on the basis of any information found on this channel, expressed or implied herein, are committed at your own risk, financial or otherwise.

Weekly Market Forecast: S&P, NAS & DOW Are Still Bullish!This forecast is for the week of Feb 10-14th.
The S&P500, the NASDAQ, and the DOW JONES are still bullish overall, despite last weeks NFP news that saw the markets move lower. Until there is a bearish break in market structure, it is buys all the way. Let the markets reach the buy zones and wait for the bullish market structure shift. That is the time to take valid buy setups.
Enjoy!
May profits be upon you.
Leave any questions or comments in the comment section.
I appreciate any feedback from my viewers!
Like and/or subscribe if you want more accurate analysis.
Thank you so much!
Disclaimer:
I do not provide personal investment advice and I am not a qualified licensed investment advisor.
All information found here, including any ideas, opinions, views, predictions, forecasts, commentaries, suggestions, expressed or implied herein, are for informational, entertainment or educational purposes only and should not be construed as personal investment advice. While the information provided is believed to be accurate, it may include errors or inaccuracies.
I will not and cannot be held liable for any actions you take as a result of anything you read here.
Conduct your own due diligence, or consult a licensed financial advisor or broker before making any and all investment decisions. Any investments, trades, speculations, or decisions made on the basis of any information found on this channel, expressed or implied herein, are committed at your own risk, financial or otherwise.

Dow Jones Bullish Scenarios for 2/6Two Ideal Morning Scenarios:
1️⃣ Price dumps to the January FOMC level , then forms a W concept, launching it past 44,400+.
2️⃣ Price drops to the 44,000 support zone before reversing for a pump beyond 44,400+.
If we open in these zones, it sets up a golden buying opportunity for all of us.
Let’s lock in!

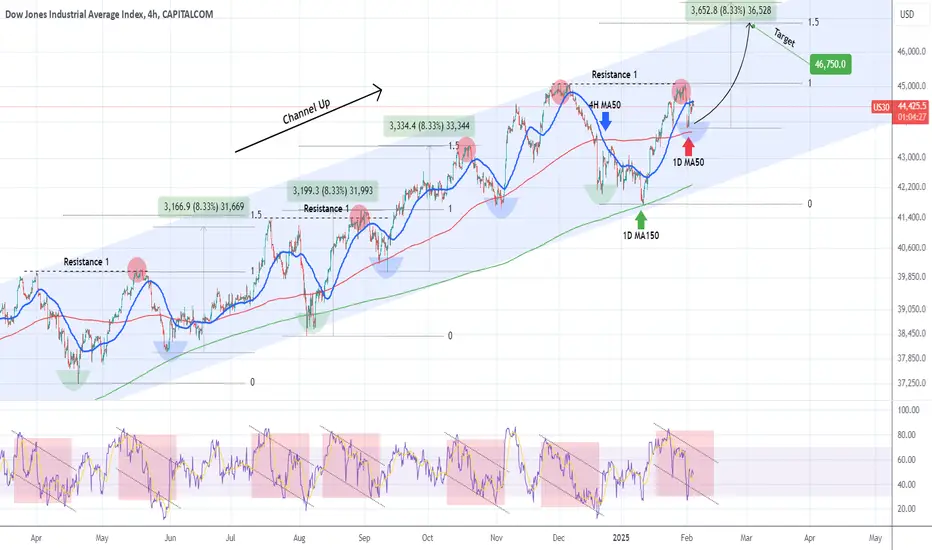
DOW JONES Can the 1D MA50 save the day once more?Dow Jones (DJIA) has been trading within a year long Channel Up and this week's pull-back has so far found Support just above the 1D MA50 (red trend-line). As this chart shows, every 1D MA50 contact that was made after a Channel Up bottom (Higher Low), was a buy opportunity as the blue arc patterns highlight.
The green arcs are the Channel bottoms and technically the strongest buy opportunities and in the past 10 months we've only had 3 of those. This is the 4th blue arc however, the medium-term buy opportunity.
Regardless of colour, the 4H RSI pattern on each of those buy opportunities, has been the same. And the resulting rally has either hit the 1.5 Fibonacci extension or made a +8.33% rise.
This time the 1.5 Fib is a bit closer to the price, so that will be our medium-term Target at 46750.
-------------------------------------------------------------------------------
** Please LIKE 👍, FOLLOW ✅, SHARE 🙌 and COMMENT ✍ if you enjoy this idea! Also share your ideas and charts in the comments section below! This is best way to keep it relevant, support us, keep the content here free and allow the idea to reach as many people as possible. **
-------------------------------------------------------------------------------
💸💸💸💸💸💸
👇 👇 👇 👇 👇 👇
Market Forecast UPDATES! Tuesday, Feb 4thIn this video, we will update the forecasts for the following markets:
ES \ S&P 500
NQ | NASDAQ 100
YM | Dow Jones 30
GC |Gold
SiI | Silver
PL | Platinum
HG | Copper
Enjoy!
May profits be upon you.
Leave any questions or comments in the comment section.
I appreciate any feedback from my viewers!
Like and/or subscribe if you want more accurate analysis.
Thank you so much!
Disclaimer:
I do not provide personal investment advice and I am not a qualified licensed investment advisor.
All information found here, including any ideas, opinions, views, predictions, forecasts, commentaries, suggestions, expressed or implied herein, are for informational, entertainment or educational purposes only and should not be construed as personal investment advice. While the information provided is believed to be accurate, it may include errors or inaccuracies.
I will not and cannot be held liable for any actions you take as a result of anything you read here.
Conduct your own due diligence, or consult a licensed financial advisor or broker before making any and all investment decisions. Any investments, trades, speculations, or decisions made on the basis of any information found on this channel, expressed or implied herein, are committed at your own risk, financial or otherwise.

DOW JONES starting a bullish streak to 48500.Dow Jones / US30 is trading inside a Channel Up since August 2022 and is right now on the 3rd straight green 1week candle.
Even though it is approaching the top of this 2.5 year pattern, the upcoming Bullish Cross on the 1week MACD indicates that the rally that is starting could be of a similar magnitude like November 2023 and October 2022.
Consequently, we expect this to reach at least the 2.0 Fibonacci extension on a diverging Channel Up.
Target 48500.
Previous chart:
Follow us, like the idea and leave a comment below!!
