DOW JONES: Bottom of the Channel Up.Dow Jones turned bearish on its 1D technical outlook (RSI = 42.00, MACD = 51.000, ADX = 21.000) as it almost hit the bottom of the Channel Up pattern. It is about to form a Death Cross on the 4H timeframe, which will be the first since August 8th that was technically the bottom of July's correction and start of the current Channel Up. We expect the bottom to be priced either today or tomorrow and the RR is good enough to buy. We aim for the 1.5 Fibonacci level (TP = 44,000), which priced the previous two HH.
## If you like our free content follow our profile to get more daily ideas. ##
## Comments and likes are greatly appreciated. ##
YM1

DOW JONES Channel Up near its bottom. Solid buy.Dow Jones / US30 is trading inside a Channel Up since late August.
The price is about to enter the buy zone of the pattern.
The previous bearish leg made a -3.81% correction before it bottomed and initiated the bullish leg to the 1.618 Fibonacci extension.
We expect a strong rebound from the current prices, so buy and target 44100 (just under the 1.618 Fib).
Follow us, like the idea and leave a comment below!!

DOW JONES Bottom is being formed. Buy for 44000 immediate TargetDow Jones (DJI) eventually made a bullish break-out on our last analysis (October 08, see chart below) and hit our 43200 invalidation Target:
The 3-month Channel Up is still holding and the price is now on the 4H MA200 (orange trend-line) and near the bottom (Higher Lows trend-line) of the pattern. The 4H RSI has completed a bottoming sequence similar to the September 11 Higher Low.
As long as the 1D MA50 (red trend-line) supports (closes 1D candles above), this will be a buy opportunity. Our Target is 44000, which is the 1.236 Fibonacci extension, similar with the previous Higher High.
-------------------------------------------------------------------------------
** Please LIKE 👍, FOLLOW ✅, SHARE 🙌 and COMMENT ✍ if you enjoy this idea! Also share your ideas and charts in the comments section below! This is best way to keep it relevant, support us, keep the content here free and allow the idea to reach as many people as possible. **
-------------------------------------------------------------------------------
💸💸💸💸💸💸
👇 👇 👇 👇 👇 👇

DreamAnalysis | Dow Jones Analysis Key Levels to Watch!✨ Today’s Focus: Dow Jones (US30) – A Key Market Mover
Today, we’re diving into the latest Dow Jones price action, pinpointing critical levels to identify potential trends and strategic trade opportunities.
📊 Market Snapshot:
The price is currently oscillating within the previous week’s range. After capturing some crucial buy-side liquidity, such as the Previous Month’s High (PMH), there’s been a strong shift to the sell side.
🔴 Short- vs. Long-Term Outlook:
We’ll break down scenarios for both bullish and bearish setups, providing insights for day traders on how to approach short-term and long-term trends.
🗣 Short-Term Outlook:
In the short term, a potential retracement higher could take out some Buy-Side Liquidity or hit the midpoint (50%) of the range. Following this, the price may continue downward toward sell-side targets, with the Weekly Imbalance as a significant level to watch.
🗣 Long-Term Outlook:
Our long-term perspective remains bearish until the price reaches the Weekly Imbalance at the 50% range mark. From there, we’ll need to observe how the market reacts to assess if further declines are likely.
🕓 Key Levels to Watch:
These levels are likely to shape price movement:
- PMH: Previous Month High
- PML: Previous Month Low
- PWH: Previous Week High
- PWL: Previous Week Low
- BSL: Buy-Side Liquidity
- SSL: Sell-Side Liquidity
- Weekly FVG: Fair Value Gap (Imbalance Zone)
Fair Value Gaps (FVGs) are crucial zones for potential retracement, setting up the next directional move.
📈 Bullish Scenario:
For a bullish setup, monitor lower timeframes (LTF) for a sweep of Low-Resistance Sell-Side Liquidity. Look for entry models targeting higher levels, including a move toward the All-Time High (ATH).
📉 Bearish Scenario:
For bearish opportunities, use lower timeframes like the 15-minute chart. Seek short entry signals within the 4-Hour Imbalance, or wait for a breakdown of Low-Resistance Buy-Side Liquidity for added confirmation.
📝 Final Thoughts:
Stay flexible as market dynamics shift. Monitor these key levels and setups to fine-tune your strategy and capitalize on high-probability trades.
🔮 Coming Up:
We’re also tracking NASDAQ, DXY, EUR/USD, and other major markets, with timely insights as trends evolve.
⚠️ Disclaimer:
This analysis is for educational purposes only and does not constitute financial advice. Always conduct your own research and consult a licensed financial advisor before making any investment decisions.

Weekly Forex Forecast Oct 28th: S&P500, NASDAQ, & DOW This is the Weekly Forex Forecast for Oct 28 - Nov 1st.
The S&P500 and NASDAQ are neutral at the moment, but the trend is bullish. Patience will pay off if we wait for confirmations to bullish orderflow.
The DOW is looking weaker than the other two. It is clear the short term profit targets are to the sell side liquidity.
Check the comments section below for updates regarding this analysis throughout the week.
Enjoy!
May profits be upon you.
Leave any questions or comments in the comment section.
I appreciate any feedback from my viewers!
Like and/or subscribe if you want more accurate analysis.
Thank you so much!
Disclaimer:
I do not provide personal investment advice and I am not a qualified licensed investment advisor.
All information found here, including any ideas, opinions, views, predictions, forecasts, commentaries, suggestions, expressed or implied herein, are for informational, entertainment or educational purposes only and should not be construed as personal investment advice. While the information provided is believed to be accurate, it may include errors or inaccuracies.
I will not and cannot be held liable for any actions you take as a result of anything you read here.
Conduct your own due diligence, or consult a licensed financial advisor or broker before making any and all investment decisions. Any investments, trades, speculations, or decisions made on the basis of any information found on this channel, expressed or implied herein, are committed at your own risk, financial or otherwise.

Average Range Levels + OHLC Statistical Mapping Short SetupMy bias for today was bearish.
My Bearish Model:
Entry: -Manipulation
Stop-Loss: 1/3ADR+
Take-Profit: -Distribution
If you have any questions and eventually wanna learn more about the tool and have chance to receive a discount code. Shoot me a dm.

DOW JONES: testing the 4H MA200 and is expected to rebound.Dow Jones is on a neutral 1D technical outlook (RSI = 48.958, MACD = 306.300, ADX = 31.951) as the Channel Up pulled back to almost test the 4H MA200 for the first time since the September 11th Low. This is basically the top of the support zone of the Channel Up and based on the 1D RSI, a strong buy candidate. We turn bullish, aiming at the 1.5 Fibonacci extension (TP = 43,900).
See how our prior idea has worked out:
## If you like our free content follow our profile to get more daily ideas. ##
## Comments and likes are greatly appreciated. ##

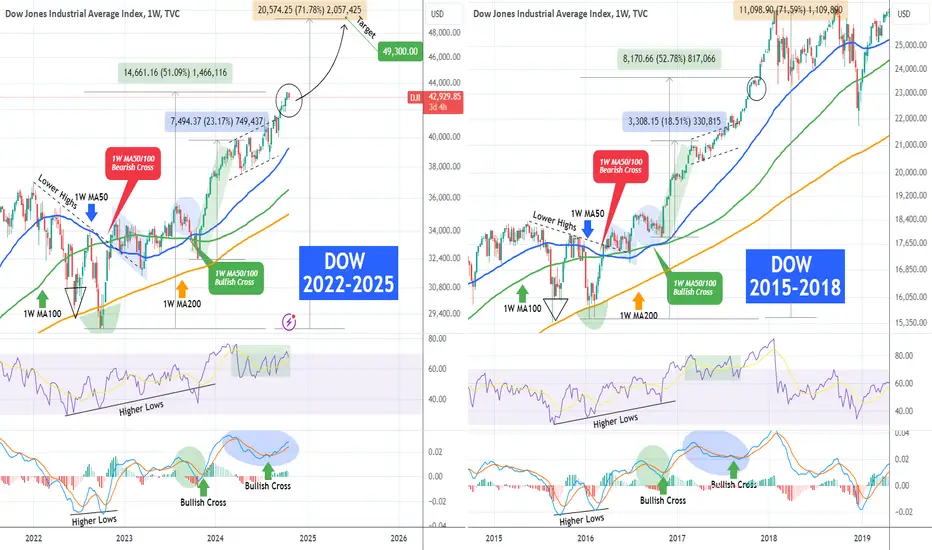
DOW JONES ahead of an huge rally based on the 2017 fractal.More than a year ago (September 13 2023, see chart below), we posted a long-term fractal comparison for Dow Jones (DJI) between the 2022 - 2025 and 2015 - 2018 periods:
As you can see the 1W MA50/100 Bullish Cross eventually placed the index on a huge rally (even though it had to go lower for a month) that hit Target 1 at 42000. The 1W RSI and MACD sequences in 2024 however evolved in such a how that we have to re-adjust the patterns in order to fit the 2017 price action.
The charts now display very symmetric fractals and it appears that we are now on a short-term consolidation (circle) after a +50% rise from the September 2022 bottom. In November 2017, that was the final consolidation before the most aggressive rally of the Bull Cycle that made Dow top and then pull back to test its 1W MA50 (blue trend-line).
As a result, we move our final target even higher at 49300, which represents a +71% rise from the 2022 bottom, similar to the rise that priced the January 2018 High.
-------------------------------------------------------------------------------
** Please LIKE 👍, FOLLOW ✅, SHARE 🙌 and COMMENT ✍ if you enjoy this idea! Also share your ideas and charts in the comments section below! This is best way to keep it relevant, support us, keep the content here free and allow the idea to reach as many people as possible. **
-------------------------------------------------------------------------------
💸💸💸💸💸💸
👇 👇 👇 👇 👇 👇
DOW JONES 1hour Channel Up on its bottom. Buy.Dow Jones / US30 is trading inside a Channel Up and the price hit its bottom today.
By doing so it almost tested the 1hour MA200, which is holding since October 9th.
Also it completed a decline identical in % terms with the first one of the pattern.
This is a strong buy opportunity. Buy and target 43,450 (top of the Channel Up).
Follow us, like the idea and leave a comment below!!

S&P500, NASDAQ, & DOW JONES Weekly Outlook Oct 21The 3 Indices are in position to move higher. I am looking for buys setups, as my bias is bullish. My first targets are the PWHs, and potentially ATHs.
I've included some notes on how I project bullish targets above ATH's. Tell me what you think of it in the comments section.
Check the comments section below for updates regarding this analysis throughout the week.
Enjoy!
May profits be upon you.
Leave any questions or comments in the comment section.
I appreciate any feedback from my viewers!
Like and/or subscribe if you want more accurate analysis.
Thank you so much!
Disclaimer:
I do not provide personal investment advice and I am not a qualified licensed investment advisor.
All information found here, including any ideas, opinions, views, predictions, forecasts, commentaries, suggestions, expressed or implied herein, are for informational, entertainment or educational purposes only and should not be construed as personal investment advice. While the information provided is believed to be accurate, it may include errors or inaccuracies.
I will not and cannot be held liable for any actions you take as a result of anything you read here.
Conduct your own due diligence, or consult a licensed financial advisor or broker before making any and all investment decisions. Any investments, trades, speculations, or decisions made on the basis of any information found on this channel, expressed or implied herein, are committed at your own risk, financial or otherwise.

DOW JONES: Turned the previous Resistance into Support.Dow Jones is bullish on its 1D technical outlook (RSI = 63.922, MACD = 449.140, ADX = 44.993) as it recovered yesterday's losses but more importantly it is rebounding at the top of the former Channel up. Having broken over it 3 sessions ago, two short term patterns emerged a Rising Wedge (HH, HL) and a Channel Up. If the HH trendline is crossed, it will be the perfect buy signal to target the top of the short term Channel Up (TP = 44,000). The 1D RSI shows that a rally similar to July 10th is possible.
See how our prior idea has worked out:
## If you like our free content follow our profile to get more daily ideas. ##
## Comments and likes are greatly appreciated. ##

DOW JONES 15 year cheat-sheet that can make you rich!Dow Jones (DJI) is extending what seems a relentless rally since the August 05 Low, which was the most recent short-term correction, but in reality the index has been rallying very aggressively since the October 23 2023 Low.
That was when after a 3-month correction, it found Support above the 1W MA200 (orange trend-line) and 2 weeks later it reclaimed the 1W MA50 (blue trend-line), which has been supporting ever since. So basically the index has been on a 1W MA50 Support for 1 whole year!
What's more striking however and what short-term traders/ investors tend to ignore are the long-term Cycles of a financial asset. And Dow being one, is no exception. As mentioned, the 1W MA200 supported the October 23 2023 Low and in effect has been holding since October 10 2022 (so for 2 full years!), two weeks after the Inflation Crisis bottom. Since then we have been inside a Bull Phase.
This is part of a greater trading Cycle for Dow, one that started 1 year after the March 2009 market bottom of the historic Housing Crisis. As you can see, the pattern is recurring and the phases have a high symmetry and frequency among them.
First and foremost, they tend to do two Lows within a 1 year span, which is essentially the Bear Phase, which finds Support on the 1W MA200 (exception was of course the Black Swan of the COVID flash crash but it is of course a non-technical irregularity event) and then rebounds, effectively starting the Bull Phase.
The first 2 Bull Phases rose by +75.80%, while the most recent by +70.80%, so we are roughly around the same strength levels. Also as far as duration is concerned, the 1st Bull Phase lasted for 1239 days (177 weeks), the 2nd for 1134 days (162 weeks) and the 3rd for 1106 days (158 weeks). Again the time element is quite similar. Notice also the similar pattern that the 1W MACD prints every time Dow enters the final part of the Bull Phase.
As a result, if we apply those dynamic conditions on the current Bull Phase, we can see that a minimum rise of +70.80% from the bottom, should peak a little over 48000, and if it last a minimum of 1106 days (158 weeks) it should come to an end and price the top by October 06 2025.
This indicates that we have at least another full year of bullish trend ahead of us and a fair Target could be 48000.
As you realize, investors who are methodically following this 15 year old cheat-sheet, know where and when to buy/ sell and that achieves investing's two main principles: Profit Maximization and Risk Management. Patience and proper management within such Cycles are what "can make you rich" indeed.
-------------------------------------------------------------------------------
** Please LIKE 👍, FOLLOW ✅, SHARE 🙌 and COMMENT ✍ if you enjoy this idea! Also share your ideas and charts in the comments section below! This is best way to keep it relevant, support us, keep the content here free and allow the idea to reach as many people as possible. **
-------------------------------------------------------------------------------
💸💸💸💸💸💸
👇 👇 👇 👇 👇 👇

DreamAnalysis | US30 on the Edge Key Levels & Crucial Scenarios!✨ Today’s Focus: Dow Jones (US30) – A Market Mover
We’ll break down the latest price movements and explore potential trends by analyzing key market levels.
🚨 Previous Analysis Recap:
In our last analysis, we anticipated a dip into the Equal Lows (EQL) before a reversal higher, and that’s exactly what played out. But what's next? Let's dive into all possible scenarios together.
📊 Current Market Overview:
The price has recently taken a major Buy-Side Liquidity (BSL) level at the Previous Month High (PMH), and we’re now hovering near the Previous Week High (PWH). This proximity to key levels sets the stage for the next move.
🔴 What to Expect: Short-term vs Long-term Scenarios
This section outlines what we can anticipate in both short-term and long-term contexts, considering both bullish and bearish possibilities for day trading.
🗣 Short-term Outlook:
A crucial focus for the short term is the previous week’s range, highlighted on the chart using Fib Retracement. Pay attention to the 50% level and the Optimal Trade Entry (OTE) zone.
We might see price break through Sell-Side Liquidity (SSL) below the 50% level to balance the range, possibly tapping into the Daily Fair Value Gap (FVG) for a rebalancing move.
🗣 Long-term Outlook:
Currently, we’re trading in a premium zone, which means two potential outcomes: continuation or reversal.
- Continuation: If the SSL above the Daily FVG is swept, we could see the price drive even higher.
- Reversal: An aggressive drop below the 4H and Daily Imbalances could trigger a reversal, leaving behind a Balance Price Range (BPR) with both bullish and bearish FVGs. The bearish FVGs, in particular, could play a crucial role.
🕓 Key Levels to Watch:
These are pivotal zones that could influence price action:
- PMH: Previous Month High
- PML: Previous Month Low
- PWH: Previous Week High
- PWL: Previous Week Low
- BSL: Buy-Side Liquidity
- SSL: Sell-Side Liquidity
- Daily FVG: Fair Value Gap (Imbalance zone)
These levels indicate where the price might seek liquidity or rebalance. FVGs represent zones where the market may retrace before continuing its trend.
📈 Bullish Scenario:
For bullish setups, we need lower time frame (LTF) confirmations, such as the 15m chart. Look for liquidity sweeps and target higher levels like the Previous Week High (PWH).
📉 Bearish Scenario:
While it’s possible to look for short entries now, the ideal scenario would be for the price to first take out the Previous Week High. After that, the target could be the Sell-Side of the chart, including the Daily Imbalance and SSL.
📝 Conclusion:
Stay adaptable as market conditions evolve. Monitoring these key levels and setups can help refine your strategy and spot high-probability opportunities.
🔮 Looking Ahead:
Stay tuned for updates as we keep an eye on NASDAQ, DXY, EUR/USD, and other major markets. Timely insights will follow as trends unfold.
⚠️ Disclaimer:
This analysis is for educational purposes only and is not financial advice. Always conduct your own research and consult a licensed financial advisor before making any investment decisions.

WEEKLY FOREX FORECAST OCT. 14-18th: BUY THE DOW? YES!The DOW looks to have supporting structure for higher prices. The bullish momentum is there, and Friday's close put that on display.
There is some potential for a limited pullback, though. But I would view it as an opportunity to get a better price on a possible long position.
What are your thoughts....?
Check the comments section below for updates regarding this analysis throughout the week.
Enjoy!
May profits be upon you.
Leave any questions or comments in the comment section.
I appreciate any feedback from my viewers!
Like and/or subscribe if you want more accurate analysis.
Thank you so much!
Disclaimer:
I do not provide personal investment advice and I am not a qualified licensed investment advisor.
All information found here, including any ideas, opinions, views, predictions, forecasts, commentaries, suggestions, expressed or implied herein, are for informational, entertainment or educational purposes only and should not be construed as personal investment advice. While the information provided is believed to be accurate, it may include errors or inaccuracies.
I will not and cannot be held liable for any actions you take as a result of anything you read here.
Conduct your own due diligence, or consult a licensed financial advisor or broker before making any and all investment decisions. Any investments, trades, speculations, or decisions made on the basis of any information found on this channel, expressed or implied herein, are committed at your own risk, financial or otherwise.

DOW JONES Short-term correction or invalidation?Dow Jones (DJI) has been trading within a Channel Up ever since the August 05 bottom and right now finds itself below the 4H MA50 (blue trend-line). This is because based on the Higher Highs sequence, the pattern has topped and is potentially looking for the new Higher Low.
As long as the 42400 Resistance is holding, we will be expecting a short-term correction towards the 4H MA200 (orange trend-line), with a projected Low around 41600. Note that it will be above the 0.5 Fibonacci retracement level, where the September 11 Higher Low was priced.
If the 42400 Resistance, which we call the invalidation level for shorts, breaks first then we will take the loss on the short and turn bullish instead. The last Higher High was priced marginally above the 1.236 Fibonacci level, so that will be our Target (43200).
-------------------------------------------------------------------------------
** Please LIKE 👍, FOLLOW ✅, SHARE 🙌 and COMMENT ✍ if you enjoy this idea! Also share your ideas and charts in the comments section below! This is best way to keep it relevant, support us, keep the content here free and allow the idea to reach as many people as possible. **
-------------------------------------------------------------------------------
💸💸💸💸💸💸
👇 👇 👇 👇 👇 👇

DOW JONES Channel Up top. Sell signal.Dow Jones topped on its 6 month Channel Up, turning sideways for the past 2 weeks.
As long as the price trades inside the Channel, this is a sell signal
Trading Plan:
1. Sell on the current market price.
Targets:
1. 41150 (potential contact with the MA50 (1d) and inside the dashed Channel Up).
Tips:
1. There is a huge Bearish Divergence on the RSI (1d), similar to the one on Jan - March 2024.
Please like, follow and comment!!
Notes:
Past trading plan:

DOW JONES: Small pullback will offer a buy opportunity.Dow Jones is about to turn neutral on the 1D technical outlook (RSI = 57.040, MACD = 399.580, ADX = 38.469) as it crossed below its 4H MA50, withi the 4H RSI already on a bearish divergence, pointing to a short term correction. We expect that to be on or a little under the 4H MA200 and then rebound (over the 0.5 Fibonacci level) like the September 11th low. Like then, we are targeting the 1.236 Fibonacci extension (TP = 43,200).
## If you like our free content follow our profile to get more daily ideas. ##
## Comments and likes are greatly appreciated. ##

DOW JONES Pull-back possible but maintain long-term perspectiveA little more than 2 months ago (July 25, see chart below) we argued that Dow Jones' (DJI) correction wasn't over and called for a deeper buy, setting then a long-term Target of 42400:
The Target got finally hit on Friday, giving us an excellent risk/ reward ratio on our investment. As however the price almost reached the top of the 2-year Channel Up, we have to issue a warning for a potential short-term correction.
The 1D MA50 (blue trend-line) has successfully supported on September 11 last time and won't be odd to see another re-test after almost a month. The similarities after all between the first part of the 2-year Channel Up and the second (the one we're currently in) are still noticeable and on 1D RSI terms we may be symmetrically around the November 20 2023 level.
However, we may see this time the Channel Up break to the upside for the first time after the elections. Regardless of the short-term volatility, our medium-term Target as we will be heading into December is 44500. That is the 2.5 Fibonacci extension, similar to where the April 01 High was priced.
-------------------------------------------------------------------------------
** Please LIKE 👍, FOLLOW ✅, SHARE 🙌 and COMMENT ✍ if you enjoy this idea! Also share your ideas and charts in the comments section below! This is best way to keep it relevant, support us, keep the content here free and allow the idea to reach as many people as possible. **
-------------------------------------------------------------------------------
💸💸💸💸💸💸
👇 👇 👇 👇 👇 👇

DOW JONES may be entering a wide 4 month consolidation phaseDow Jones / US30 reached the top of the historic Channel Up that started 2 years ago on October 3rd.
Technically that calls for a strong short. Last time that happened in April 1st, the index turned sideways on a wide consolidation.
The other 2 Higher High rejections caused Channel Down corrections.
Technically the time to rebound again will be closer to the 1week MA50 but that can be in December.
Until then, buy low and sell high within 42250 and 43350.
Follow us, like the idea and leave a comment below!!

OHLC Statistical Mapping ShortOne of the short model:
+Distribution was entry, SL was space between -Manipulation & +Distribution
target: +Distribution

DOW JONES: At the top of the six month Channel Up.Even though Dow Jones has reached the top of its Channel Up pattern, it remains on very balanced bullish technicals on the 1D time-frame (RSI = 62.120, MACD = 487.030, ADX = 32.488). Our trading plan will be based upon breakouts. As long as the price remains under the top of the Channel Up and over the dashed trendline of the August wave, it is a no action (do nothing). If it crosses above the top of the Channel Up, it's a buy (TP = 43,500) as most likely we will see an extension of the wave to a new +8.28% rise. If the price crosses under the dashed trendline, its a sell (TP = 40,900) to the 1D MA50 at least.
See how our prior idea has worked out:
## If you like our free content follow our profile to get more daily ideas. ##
## Comments and likes are greatly appreciated. ##

DJ ShortI will be looking to short DJ and Russel till the NFP day.
Disclaimer: Not a financial advice. Do your own analysis

OHLC Statistical Mapping Friday LongAnother long model:
-Distribution to -Manipulation
basically reversed psychology, normally you would trade something similiar in bearish scenario.
