YOYO - from the traders perspectiveYOYO - IDK how fundamentals are holding. This coin could be delisted in upcoming months. But from a traders perspective. RSI oversold 1D, ATL BTC pair.
RED color: Support line, ORANGE color: resistance,
GREEN color are goals: 40 satish and 60 later. cold go to 100.
I wouldn't hold this for a LONG.
YOYOBTC

YOYOW Goes Bullish (100%+ or Maybe 800%)I had drawn three different paths for YOYOBTC in my previous analysis, see it here:
It has chosen the fastest route... YOYOBTC can move straight up now that its price is above EMA100 (blue line).
Notice the left side, yellow square...
The price jumps on this pair tend to be fast and strong.
Something similar can happen soon.
Easy we can see 100%+, being conservative. In reality, it can go to 500% or even 800% in growth.
Namaste.

YOYOW Aims Higher But Needs To Break Resistance!YOYOBTC (YOYOW) starts to aim higher but still has to break resistance.
The last four days we have green candles yet prices remain below EMA50 and the 39 satoshis (0.00000039) barrier.
Between 32-39 is the consolidation zone within the current support level.
Above 37-39 we go bullish.
Below 32 there can be additional drop.
We are aiming higher of course...
Patience is key.
Additional details on the chart.
Huge potential for growth long-term.
Namaste.

YOYO/BTCBreaking out daily time frame + Sitting on strong support zone .
If BTC calms down a bit ALT BTC pairs could fly .
Would like to see a clean pull back to the mentioned area before aping in.
NOT FINANCIAL ADVICE.

Yoyow is in the early phase of an uptrendA potential altseason for sure will help these projects' prices.
I am not sure about the project timeline etc but I see a positive slope.
The next bull targets can be 145 and 204. Further price levels can also be seen in the next term.

YOYOBTCOn 2h chart it has dropped below MA200~360 and it has some more space to go down so maybe another touch with the daily MA200

YOYO IDEA !! Potential PUMP Soon !!you can buy now or wait and watch if we can touch 77-79 again if bitcoin moved again
Targets in green lines , good luck
For Donation If u like my analysis :
USDT : 0xaeac0e3d230da8b26d05af618e74c557a917315f
BTC : 1HuiRoQvUF2p5rf1YhPFZebuCJNSjXChkZ
ETH : 0xaeac0e3d230da8b26d05af618e74c557a917315f


YOYOW (YOYO) Higher Lows + Next Target At ~100%YOYOW (YOYOBTC) has been printing higher low since early January 2021, we can see a clear uptrend being shaped.
We have another higher low in early February and then again in early March.
After each higher low, we get a higher high, so far.
YOYOBTC is now bullish.
Prices trading above EMA50 and EMA100.
Very strong indicators (MACD and RSI).
Low volume (the action is yet to start).
We are very likely to hit a higher high next.
We are looking at 98 satoshis (marked yellow on the chart) and beyond.
Thanks a lot for reading.
Namaste.

YOYOBTCYOYOBTC crossed SMA 200 in Daily chart and crossed up the bearish trend line as well
so it looks well to buy
what do you think ??


YOYO/BTC - minimum target EMA50 (UPTREND)YOYO is yet to explode 👀
On the weekly chart we have a 600-day downward channel with Bullish Divergence on RSI and MACD
🎯 First target is the EMA50
If we break above it, we would look for a massive rise +1000%
"This is just my opinion, trade with your trading system
Have a nice day and come back again."
Go to my free channel and chat with other traders. Link in the description
Write your opinion, whether there is a place to buy here, and open a long position


YOYOW (YOYO) Cup & Handle Pattern Target MappedYOYOBTC (YOYOW) printed the classic Cup & Handle chart pattern and is now hitting a new high compared to late December... Get ready.
Resistance is being faced at EMA200/MA200 (brown/black lines) while EMA100 (blue) was conquered recently and tested as support.
Prices are very likely to continue higher printing steady sustained growth for YOYOBTC.
This is true for many other altcoins...
Right now, patience is key.
Namaste.


YOYOW Aiming For A New Round!After a very strong correction, YOYOBTC ended up wicking higher 24-Dec. compared to 4-Nov.
Right now prices are moving above EMA10 which is a bullish signal.
It is likely that YOYOW will go on a new bullish round.
The stop-loss/support level is set at 40 satoshis (0.00000040).
Remember to build your own plan/strategy if you decide to trade.
Namaste.
Dec. 11 | Previous chart | YOYOW (YOYO) Strong Chart... Can Do More...

YOYO/BTC the return begins ...Hello friends. Yoyow has been increasing for a few days. But I noticed that there are small amounts of robot purchases on the Binance stock exchange. This brings me to the question that will make the binance yoyow token out of the list. If it cannot exceed the resistance I show in the graph, it will see the lower level. This money is easy to manipulate. Therefore, it is useful to be careful.
It is not investment advice. Do not forget to like and follow. :))

YOYO-BTC 50%...Previous idea +70%. Pretty simple and predictable tool for trading. The price has depreciated by 99%. The main trend is downward, the price has formed a channel width of 50% for over a year. From May to September the price was in the upward secondary trend and reached the boundary of the channel, where on 16.08 there was the culmination of purchases. Then we see a break-down of the lower boundary of the uptrend channel. At present, the price has reached the lower boundary of the channel, a falling wedge has been formed locally and the figure may become a reversal. Is it possible to go below the channel boundary - yes, but at the moment the instrument is against the market.
Possible trading styles: from the lower border of the channel, to a wedge breakout, to a breakout of the upper border of the channel.

YOYOW (YOYO) Strong Chart... Can Do More... YOYOBTC had a massive breakout yesterday and today is looking really good.
We had a drop to 64 satoshis (0.00000064) with prices going below support, but we can see a strong recovery and a new high being hit.
As you can see marked on the chart, the 70 satoshis level is very important... Staying above this level can signal additional growth.
Here is the previous chart | Dec. 3 (YOYOW (YOYO) Will Also Grow Strong!)
Thanks a lot for reading.
Remember to hit LIKE if you want to see more altcoins charts like this one.
Namaste.

YOYOW (YOYO) Will Also Grow Strong!You can thank me later after you see the results...
It can take a few days/weeks just as it can take a little over a month, but when it starts to move it will grow by 100% or more.
Being conservative, the last bullish wave produced growth in the range of 250% to 500%... With some altcoins going even higher.
This time around the general growth overall will be much more and instead of new lows when prices correct we will see the alts print higher lows.
If you are reading this now you have great timing...
The altcoins market is about to grow really strong.
Namaste.

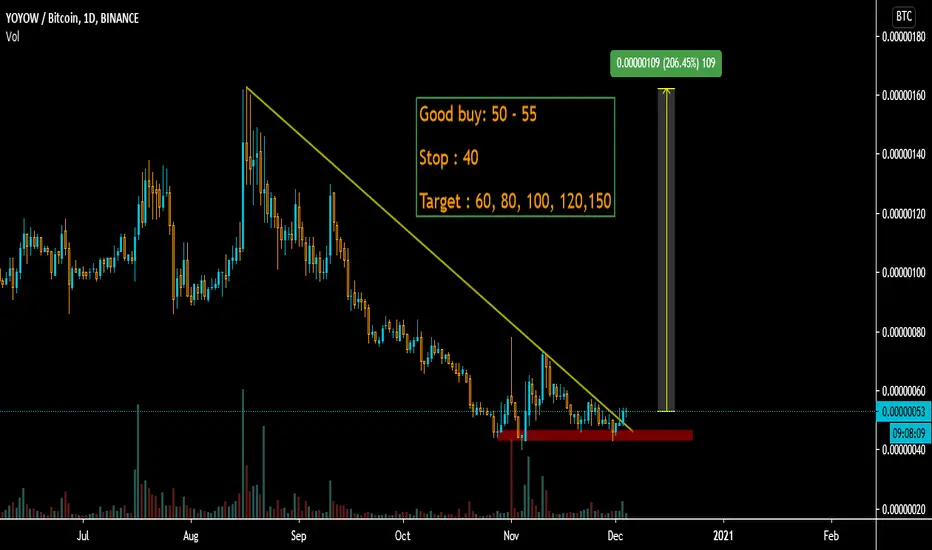
YOYO Coin Daily Breakoutprice made really good breakout on daily trend line
if you want to enter than buy 50 - 55
yoyow is old coin and we have lots of strong fundamental coin
not suggesting to new people a recent binance de-list done and yoyow saved itself so no reason to worries about de-listing of coin.
risk taker can enter here with stop below 40 sats