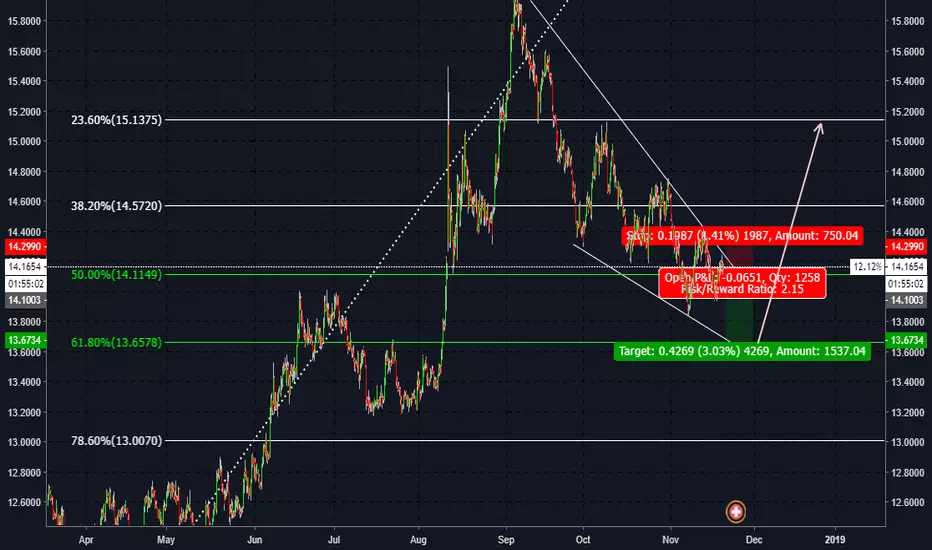
CHF/ZAR Update - Update to 11-20-18 (Link Included)CHF/ZAR Update
If you followed the trade idea I posted on my TradingView on 11-20-18 (), we see how we have progressed. As charted, we hit TP. Hopefully you took your profits as noted on December 4, 2018. The reversal did occur as expected and we saw a series of impulsive moves and corrections (see current flag). Be sure your profits are protected. Although I anticipate another push to the upside, it does not have to continue. Please note all ideas are simply ideas. Exotic pairs especially are extremely volatile. Trade at your own risk and always, always always exercise proper risk management. Happy New Year to all! 2019 will be a great year!
ZAR

JSE - Currently looking for any type of violation on support line with a solid close below this will validate the Short setup
- GREENBACK ON THE BACK FOOT WHILE THE BULLS ARE IN CONTROL With the ZAR

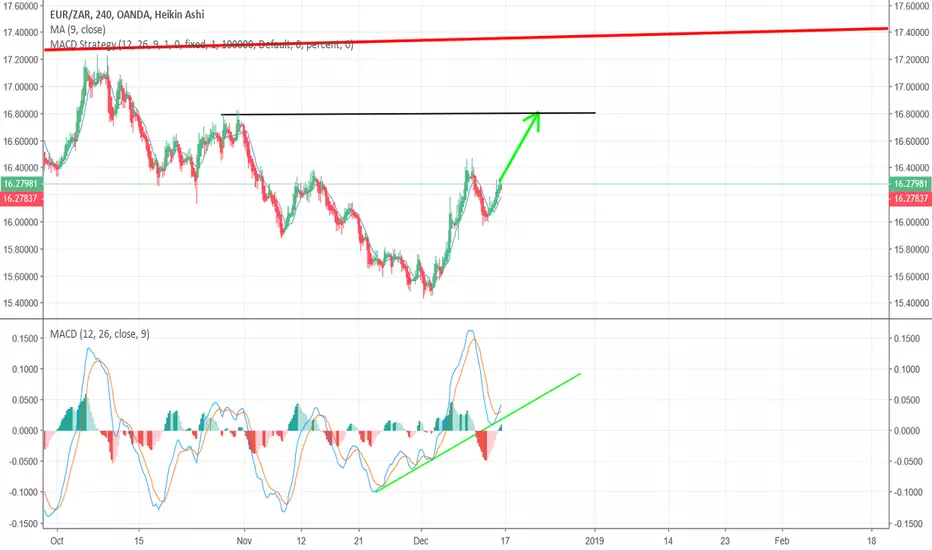
EURZAR Long PositionExpect the EUR and USD to gain some strength over many developing countries currencies in the near future. We had a positive daily green pip movement corresponding nicely with our MACD! I am however going to be looking closely at the riots occuring this weekend in France as things can get out of hand really fast with the political climate in that country and the impact it might have on the Eurozone in general.
APN - Double BottomJSE:APN has formed a bullish harami on a double bottom which means it should be good for a long position.

USDZAR approaching resistance, potential drop! USDZAR is approaching our first resistance at 6.8172 (horizontal pullback resistance, 50%, 61.8% Fibonacci retracement, 100% Fibonacci extension) where a strong drop might occur below this level pushing price down to our major support at 6.600 (horizontal swing low support, 100% Fibonacci extension).
Stochastic (34,5,3) is also approaching our resistance and we might see a corresponding drop in price should it react off this level.

USDZAR Bullish Wedge, Part 2Sometimes i just get really scared of myself :) Anyway, so far going almost perfect. The entries are already in since the bounce up was so strong this time. I have added a third entry for this game plan, that is if we see a daily close above that red zone, i will add even more to this position if we see something like a bull flag happening.
If this plan works out, i will take profit in 4 parts towards the target, but leaving 25% open with a tight stop below it, just in case this wave up would get extended.
Previous analysis:

USDZAR bullish wedgeThere is possible bullish wedge here. It's not the best one but there are many good characteristics of a wedge. I am going to play it safe and will wait a bit more before i will get in. I want to see it go towards the support line one more time and see it get find some support there. Then i will get in with half a position and make the position complete after the breakout.

USDZAR approaching support, potential bounce! USDZAR is approaching our first support at 13.60 (100% Fibonacci extension, 50%, 78.6% Fibonacci retracement, Horizontal pullback support, Descending channel support) where a strong bounce might occur above this level pushing price up to our major resistance at 13.97 (61.8% Fibonacci extension, 38.2% Fibonacci retracement, Horizontal overlap resistance).
Stochastic (55,5,3) is also approaching our support and we can see a bullish divergence where we might see a corresponding bounce in price.

ZARJPY: Approaching the Resistance.The price action has been narrowed down from a Channel Up to a Rising Wedge on 1D (RSI = 63.891, MACD = 0.106, Highs/Lows = 0.0795). Technically every pull back up to 8.000 is a buy towards the 8.550 Resistance (ext. 8.876).
** If you like our free content follow our profile (www.tradingview.com) to get more daily ideas. **
Comments and likes are greatly appreciated.

CHF/ZAR Short IdeaPrice is forming a descending wedge. Anticipate pull back to the 61.8% fib level, after which bullish price reversal. This trade is for educational and demonstration purposes only. Trade at your own risk.
EURZAR (CONTINOUS DOWNTREND)I am looking at this pair to continue down
owing to the current weak EUR and strong ZAR fundamentally an tech.
I would love to see this retrace for better entry and small SL.
or keep selling and breaking the support for good entry.

ZAR/JPY 1H Chart: Rising wedge in sightThe ZAR/JPY currency pair breached a long-term descending channel north at the beginning of November. The South African Rand has been depreciating against the Japanese Yen since the end of August. This movement has been bounded in a rising wedge.
Currently the exchange rate is testing the resistance level formed by the Fibonacci 50.00% retracement at 8.23. Given that the pair is being supported by the 55-, 100– and 200-hour SMAs, it is expected that the pair target the upper wedge line located circa 8.46 in the nearest future.
If given wedge holds, it is likely that a reversal south occurs within the following trading sessions.

USDZAR approaching resistance, potential drop! USDZAR is approaching our first resistance at 6.8172 (horizontal pullback resistance, 50%, 61.8% Fibonacci retracement, 100% Fibonacci extension) where a strong drop might occur below this level pushing price down to our major support at 6.6009 (horizontal swing low support, 100% Fibonacci extension).
Stochastic (34,5,3) is also approaching resistance and we might see a corresponding drop in price.

USDZAR approaching support, potential bounce!USDZAR is approaching our first support at 6.6135 (horizontal swing low support, 61.8%, 100% Fibonacci extension) where a strong bounce might occur pushing price up to our major resistance at 6.7134 (horizontal swing high resistance, 61.8% Fibonacci extension, 23.6%, 50% Fibonacci retracement).
Stochastic (34,5,3) is also approaching support and seeing a bullish divergence and we might see a corresponding bounce in price.

USD/ZAR 1H Chart: Downside potentialThe US Dollar has been depreciating against the South African Rand gradually since the beginning of August. This movement has been bounded in a falling wedge.
During this week the pair has been trying to breach the resistance level formed by the weekly R1 at 14.54. Given that the exchange rate is being pressured by the 55-, 100– and 200-hour SMAs, it is expected that the rate targets the lower wedge line located circa 13.85 within the following sessions. Technical indicators also support bearish scenario.
If given wedge does not hold, a breakout south might occur. Potential downside target is the Fibonacci 50.00% retracement at 13.58.

EUR/ZAR - Buying OpportunityThere is currently a bullish opportunity with EUR/ZAR.
As long as it does not close under it's current support zone which is at ~1.1612 the bullish move is valid.
Trade safe.

USDZAR is approaching resistance, potential drop! USDZAR is approaching our first resistance at 6.8630 (horizontal overlap resistance, 100% Fibonacci extension, 38.2% Fibonacci retracement) where a strong drop might occur below this level pushing price down to our major support at 6.6179 (horizontal swing low support, 100% Fibonacci extension).
Stochastic (21,5,3) is also approaching resistance and we might see a corresponding drop in price.


USDZAR approaching support, potential bounce! USDZAR is approaching our first support at 6.7169 (horizontal swing low support, 61.8%, 100% Fibonacci extension, 23.6% fibonacci retracement) where a strong bounce might occur pushing price up to its resistance at 6.8762 (horizontal overlap resistance, 100% Fibonacci extension, 38.2% Fibonacci retracement).
Stochastic (21,5,3) is also approaching support and we might see a corresponding bounce in price.


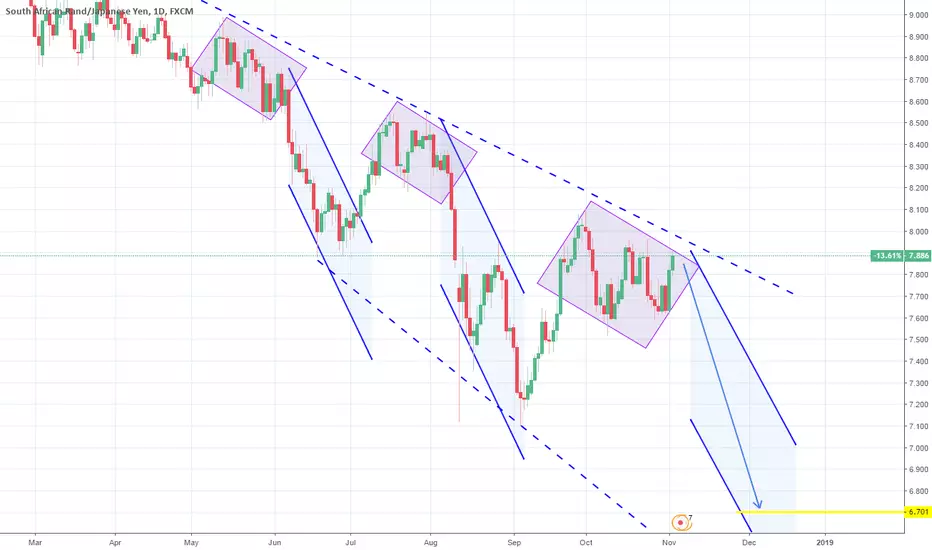
ZARJPY: Extreme scenario based on recurring patterns.This pair has been trading on a very long term bearish pattern on the 1M chart (RSI = 44.631, MACD = -0.196, Highs/Lows = -0.1826, B/BP = -0.8800) and the neutrality on the 1W chart (5 indicators) suggests that a High has been reached. The bands appear to be widening for the supports, so we are short with TP = 6.700.
EURZAR: Significant long term downside gap. Short.The pair is trading on a very long term 1M Channel Up (RSI = 57.375, MACD = 0.349, Highs/Lows = 0.2662, B/BP = 1.5626) that has a sizable downside gap to fill in the attempt to price a Higher Low. Our action plan is to short towards 15.08674 and then buy for the next Higher High (pattern continuation) with TP = 18.5000.

AUDZAR: 1D Channel Down. Short.The pair is attempting to develop a Channel Down on 1D by currently pricing a Lower High. 9.9000 can be taken as a potential short target.
