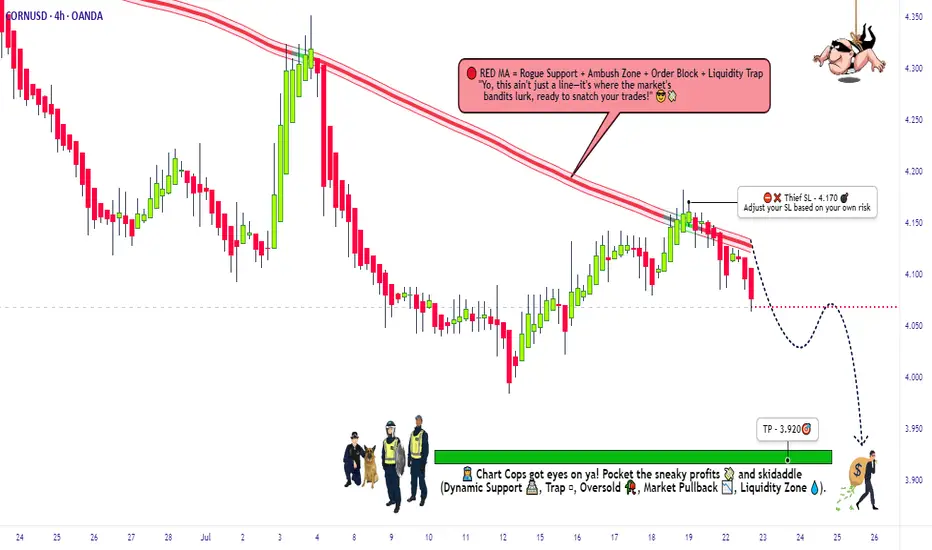
CORN Heist: Steal Short Profits Before Bulls React!🚨 CORN HEIST ALERT: Bearish Raid Ahead! 🚨 Swipe the Loot Before Cops Arrive! 🌽🔻
🌟 Attention, Market Bandits & Profit Pirates! 🌟
🔥 Thief Trading Intel Report 🔥
The 🌽 CORN CFD market is setting up for a bearish heist—time to short-swipe the loot before the bulls rally their defenses! Police barricade (resistance) is holding strong, but oversold conditions + consolidation hint at a trend reversal trap. High-risk, high-reward—just how we like it!
🎯 Heist Strategy (Swing/Day Trade)
Entry (Bearish Raid) 🏴☠️
"Vault’s unlocked! Swipe shorts at any price—OR set sell limits *near 15M/30M pullbacks for a cleaner steal!"*
Stop Loss (Escape Route) 🛑
Thief’s SL at nearest 4H swing high (4.170)—adjust based on your risk tolerance & lot size.
Pro Tip: Tighten SL if trading multiple orders!
Target (Profit Escape) 🎯
3.920 (or bail early if cops (bulls) show up!)
🌽 Market Snapshot: Why CORN is Ripe for a Raid
Neutral trend leaning bearish—consolidation breakout likely!
Key Drivers:
Macro pressure (USD strength, crop reports)
COT data hinting at big players positioning short
Seasonal trends favoring downside
Want full intel? 🔍 Check COT reports & intermarket analysis!
🚨 Trading Alerts (Avoid the Cops!)
News = Volatility Trap! 📰🚔
Avoid new trades during high-impact news.
Trailing stops to lock profits on running heists!
💥 Boost This Heist! 💥
"Like & boost this idea to fuel our next raid! More steals = more profits for the gang! 🏴☠️💰
Stay tuned—another heist drops soon! 🚀🤝
Corn
THE GREAT CORN GRAB! (Bearish CFD Heist)🌽 THE CORN HEIST: Bearish Raid Plan (Swing/Day Trade) 🚨💰
🌟 Attention, Market Robbers & Money Makers! 🌟
(Hola! Oi! Bonjour! Hallo! Marhaba!)
🔥 Based on the ruthless Thief Trading Style (TA + FA), we’re plotting a bearish heist on the CORN Commodities CFD Market! Time to short like a bandit and escape with profits before the bulls catch us! 🏴☠️💸
🎯 MASTER HEIST PLAN (BEARISH RAID)
Entry Point (Sell Limit / Market):
"The vault is open—swipe the bearish loot at any price!"
🔹 *For safer heists, set sell limits near pullbacks (15M/30M).*
Stop Loss (Escape Route):
📌 Thief SL at nearest swing high (1D timeframe) – 4.4000
📌 Adjust SL based on risk, lot size, & multiple orders.
Profit Target (Escape Before Cops Arrive):
🎯 4.1000 (or exit early if the trap snaps shut!)
🌽 MARKET TREND: NEUTRAL (BEARISH OPPORTUNITY!)
Consolidation zone = Thief’s playground!
Oversold? Maybe. But the real trap is where bullish robbers get slaughtered.
High risk = High reward—only for cold-blooded traders!
📡 FUNDAMENTAL INTEL (DON’T SKIP THIS!)
🔗 Get full reports (COT, Macro, Seasonals, Sentiment, Intermarket Analysis) in our bio0!
🚨 TRADING ALERT: NEWS = DANGER ZONE!
❌ Avoid new trades during news!
🔐 Use trailing stops to lock profits & escape alive!
💥 BOOST THIS HEIST! (HELP US ROB THE MARKET!)
🔥 Hit LIKE & FOLLOW to strengthen our robbery squad!
💸 More heists = More profits. Stay tuned for the next raid!
🐱👤 See you in the shadows, bandits! 🤑🚀

ZCU25 CORN... It ALWAYS comes down to cornAND I'M BACK AND DUMBER THAN EVER
Listen up Honkies, this trade has a 93% probability based on the historical data over the last 30 years. So I bet Muhammad my 3rd ex-wife and a half of my second step child. The reason this trade works is easy! We all have felt and understand FUD (Fear, Uncertainty, and Doubt) and how the market reacts, I understood this on my second ex-wife when she got a boyfriend. So in late June pollination season occurs with corn and the yield is unknown for the next year, this is a very simple way of looking at the agricultural industry and how the market corrects. The trade is set up in two stages in order to maximize profit. The first stage, with the FUD in pollination season typically results in a 15-20% drop, I split the difference at 17% lets make it easier than my first divorce. This usually occurs around June 26th and can extend to July 17th. Around July 15th to the 20th the projected yield is shared and the market recorrects to the upside as the numbers represented due to the FUD don't represent the price action in the futures market, and because the futures market is speculatory (Adult Gambling) the degens will pump the contracts up looking for a quick buck like my third wife. Now in order to not go broke while you're trying to buy your ex wife's boyfriend's son a new car, you need to hedge the contract in a calendar spread aka intra-commodity spread, so do the opposite in combination on the march 2026 corn contract as the maintance is lower and the price action isn't there due to open interest in the market, so let that contract ride if it goes against you. SO! you short the ZCU25 while longing the ZCH26, then offset the contracts when direction changes and long ZCU25 and short ZCH26, it's as easy as 1,2,8. Had to repost this forgot the Tags my bad.
"all I need is one trade to pay all the alimony for this year."
-KewlKat

CORN.c CORN.c Short Trade Plan (Daily Timeframe)
📍 Trade Setup
Direction: Short
Entry: Instant / Current Market Price (CMP)
Stop Loss (SL): 465.97
Take Profit 1 (TP1): 403.36 (≈ 1:1 Risk-Reward)
Take Profit 2 (TP2): 387.00 (≈ 1:1.5 Risk-Reward)
📊 Technical Justification
Trend: Downtrend confirmed – price forming Lower Highs and Lower Lows.
Candle Pattern: Bearish shooting star near resistance – strong rejection signal.
🌽 Top 3 Bearish Fundamental Reasons
Favorable U.S. Weather Conditions
→ Ideal for crop growth → higher yield expectations → bearish pressure.
Weak Global Export Demand
→ Sluggish corn exports (e.g., China slowdown) → less global demand for U.S. corn.
Strong U.S. Dollar
→ Makes U.S. corn more expensive internationally → lowers export competitiveness.
🎯 Risk Management & Execution Plan
Risk-Reward (TP1): ~1:1
Risk-Reward (TP2): ~1:1.5
📌 Once TP1 is hit:
✅ Move SL to Entry (Breakeven) to protect capital and ride remaining position to TP2.

Shady CORN Scheme: Bullish Plot or Market Trap?🌟 Ultimate CORN Heist Strategy: Swing Trade Plan 🌟
Greetings, Wealth Chasers & Market Mavericks! 🤑💸
Ready to pull off a legendary heist in the 🌽 CORN Commodities CFD Market? Our Thief Trading Style blends sharp technicals and fundamentals to craft a high-octane plan for massive gains. Follow the strategy below, stick to the chart, and aim to cash out near the high-risk Red Resistance Zone—an electrified level where overbought conditions, consolidation, or trend reversals could spark traps from bearish bandits. Let’s lock in profits and treat ourselves to the spoils! 💪🎉
📈 Entry Plan: Launch the Heist! 🚀
Wait for a breakout above the Moving Average at 4.5800 to ignite your long entry—bullish riches are calling!
Option 1: Set Buy Stop Orders just above the MA for breakout confirmation.
Option 2: Place Buy Limit Orders on a pullback to the most recent swing low/high within a 15- or 30-minute timeframe.
📢 Pro Tip: Set an alert on your chart to catch the breakout in real-time! ⏰
🛑 Stop Loss: Protect Your Loot! 🔒
For Buy Stop Orders, place your Stop Loss after the breakout confirms to avoid premature exits.
Thief SL Recommendation: Set at the recent swing low on the 4H timeframe (4.4300) for day/swing trades.
Adjust SL based on your risk tolerance, lot size, and number of open orders—play it smart! ⚠️
Feeling rebellious? Set your SL wherever you dare, but don’t blame us if the market bites back! 😎🔥
🎯 Target: Grab the Gold! 🏴☠️
Aim for 4.8000—take partial profits or exit fully before hitting this level.
Scalpers: Stick to long-side scalps. Got deep pockets? Jump in now. Otherwise, join swing traders for the full heist.
Use a trailing Stop Loss to lock in gains and keep your money safe. 💰
🌽 CORN Market Outlook: Why This Heist Works 🌟
The CORN CFD market is currently neutral but shows strong bullish potential, driven by:
📰 Fundamentals: Check macroeconomic data, COT reports, geopolitical events, and news sentiment for a full picture.
📊 Intermarket & Seasonal Analysis: Aligns with favorable positioning and future trend targets.
⚠️ Trading Alert: News & Position Management 🚨
Avoid new trades during major news releases to dodge volatility spikes.
Use trailing Stop Loss orders to secure profits and protect open positions.
Stay updated via reliable sources like Investing.com for real-time news impacting CORN prices.
💥 Boost the Heist! 🚀
Support our Thief Trading Style by hitting the Boost Button to amplify our robbery squad’s strength! 💪 Together, we’ll swipe profits effortlessly every day. Stay tuned for the next heist plan—more riches await! 🤑🐱👤
Let’s make this CORN heist legendary! 🌽💸🎉

Front-loaded Exports has fuelled rally in Corn. Can it last?After President Trump instituted broad new tariffs on 2nd April 2025, corn futures initially wavered but then rallied sharply. While this may seem counterintuitive given tariffs' disruptive impact on trade, near-term support for corn comes from front-loaded U.S. exports, a weaker dollar, and lower-than-expected domestic supply.
However, prices are likely to face downward pressure as the U.S. harvest season approaches. This paper examines the short-term bullish factors, outlines the potential risks ahead, and presents a hypothetical trade setup involving a calendar spread on CME Micro Corn futures.
CME Corn futures gapped lower on 3rd April but quickly recovered, jumping 4.5% over the next three trading days to six-week highs by 9th April. This move aligns with the typical spring seasonal trend, as corn often firms in late spring during planting & strong demand season.
Surging Export Commitments Amid Tariffs
Export commitments have surged post-tariff announcement. USDA reports that U.S. exporters had already booked about 85% of the 2024/25 season target by early April, according to Reuters , well above the 5‐year average.
In the week ending 3rd April, net U.S. corn sales hit ~40.2 million bushels, reflecting heavy front-loading. Large private sales continue: for example, in early April exporters announced a 9.4-million-bushel sale of 2024/25 corn to Spain.
These front-loaded sales (especially to Mexico & Europe) suggest buyers are rushing to secure supply before possible trade disruptions. Overall, extraordinarily strong export pace and large “flash” sales are underpinning the market.
Supply is Weaker than Initially Thought
USDA’s April WASDE cut U.S. 2024/25 ending stocks to just 1.465 billion bushels – a 75 million bushels reduction – implying a stocks/use ratio around 9.6%. For context, that ratio is near multi-decade lows for corn. The USDA simultaneously raised exports to 2.55 billion bushels, a full 100 million bushels above the previous estimate.
On the supply side, USDA’s Prospective Plantings (March 2025) projected 95.3 million corn acres for 2025, roughly 5% higher than 2024, above expectations (highlighted by Mint Finance in a previous paper ). This suggests that while near-term stocks remain stressed the situation is likely to improve drastically following the harvest.
Weaker Dollar Supports Increased Corn Exports
A key bullish factor for U.S. corn exports is the recent weakness of the U.S. dollar. After the tariff announcement, the trade-weighted dollar tumbled – hitting fresh lows (e.g. a 10-year low versus the Swiss franc). Through April 10, the dollar was down ~2–3% on the week. A weaker dollar makes U.S. corn cheaper for overseas buyers, supporting export competitiveness. With dollar at multi-year lows, U.S. corn is more attractive globally, partly offsetting any Chinese retaliatory tariffs.
COT and Options Data
Managed-money funds have dramatically pared back their long corn bets since the beginning of March. CFTC COT data show net long positions peaking around 364,000 contracts in early February, then plunging to ~54,000 by the 8th April report. However, the pace of decline has slowed dramatically over the past few weeks and seems to be signalling an end of the cutback by asset managers.
Interestingly, despite the tariff introduction (2/April) and the WASDE release (10/April), implied volatility (IV) moderated. IV has since normalized from the spike observed in March. During this period, skew also declined, reaching a negative value on 8th April - indicating that put options briefly became more expensive than calls.
Although this trend has since reversed, skew remains near its lowest levels in 2025, suggesting sustained interest in put options among market participants.
Source: CME CVOL
OI shift over the past week also signals a cautious tone despite the rally. Near term options have seen an increase in put OI, suggesting participants remain cautious despite the rally.
Source: CME QuikStrike
Hypothetical Trade Setup
While bullish factors have driven a sharp rally in corn prices over the past two weeks, there are dark clouds on the horizon. Tariffs risk disrupting trade and as most importers have already loaded up on US corn, they could slow the pace of future purchases.
Additionally, a downbeat seasonal trend along with an expected bumper harvest signal that prices could reverse sharply from here. On the technical front, momentum remains solidly bullish but approaching a potential overbought level amid a slowing bullish trend.
Corn prices remain pressured from a bumper harvest expected in September. Along with expected trade disruptions and a slowdown in the pace of US exports, prices are likely to decline during the summer. Regardless, prices remain bullish in the near term from a weakening dollar and near-term front loading.
To express views on these converging trends, investors can deploy a calendar spread on CME Micro Corn futures consisting of a long position on the near-term May contract (MZCK2025) and a short position on the September contract (MZCU2025). A hypothetical trade setup providing a reward to risk ratio of 1.8x is mentioned below:
A calendar spread on CME Micro Corn Futures is highly capital efficient with the above trade requiring maintenance margin of just USD 23 as of 15/April. The position remains protected from near-term price increase but benefits from the eventual price decline in September during harvest season.
MARKET DATA
CME Real-time Market Data helps identify trading set-ups and express market views better. If you have futures in your trading portfolio, you can check out on CME Group data plans available that suit your trading needs tradingview.com/cme .
DISCLAIMER
This case study is for educational purposes only and does not constitute investment recommendations or advice. Nor are they used to promote any specific products, or services.
Trading or investment ideas cited here are for illustration only, as an integral part of a case study to demonstrate the fundamental concepts in risk management or trading under the market scenarios being discussed. Please read the FULL DISCLAIMER the link to which is provided in our profile description.

Short Idea On ZC1! (Corn)1)On Cot data,we can see the commercials shorting at the extremes.
2)Seasonality gives us a short bias and quantitative data shows 80% win rate for shorts.
3) We overvalued on daily and weekly timeframe against several benchmarks
4) On weekly timeframe,the price rejected the EMA Forming a Pin bar reversal
5) I set the entry and stoploss on the supply structure as you can see in the picture

What Lies Beyond the Cornfield's Horizon?The narrative of corn in the global agricultural scene is not merely about sustenance but a complex ballet of economics, innovation, and policy. This staple crop stands at the intersection of international trade, with U.S. farmers gaining a foothold in Mexico's market through a significant legal victory against GMO corn restrictions, highlighting the nuanced dance between technology and trade agreements. Meanwhile, Brazil's agricultural strategies reveal a shift towards leveraging corn for ethanol, showcasing a potential future where corn could play an even more pivotal role in sustainable energy solutions.
In science and technology, the development of digital corn twins presents a frontier in crop breeding. This innovative approach could redefine how we think about plant resilience and efficiency, potentially leading to crops tailored to withstand the capricious whims of climate change. The challenge lies in translating theoretical models into practical, field-ready solutions that can benefit farmers and consumers alike.
However, the journey isn't without its threats. The unexpected rise of corn leaf aphids in 2024 serves as a stark reminder of the ongoing battle with nature's unpredictability. Farmers are now challenged to anticipate and manage these pests, pushing the boundaries of traditional farming practices into more predictive, data-driven methodologies. This situation beckons a broader inquiry into how agriculture can evolve not just to react but preemptively adapt to ecological shifts.
As we look beyond the cornfield's horizon, we see a landscape where policy, technology, and biology converge. The future of corn involves navigating this triad with foresight, ensuring that each step taken today not only secures current yields but also plants the seeds for a sustainable agricultural legacy. This exploration into corn's evolving role invites us to ponder how we can harness these developments for a future where food security and environmental stewardship walk hand in hand.

crypto is crypto, but do you need to buy corn? - If the trend line breaks, this is the beginning of a bullish trend.
- a Formulated is Golden Cross Moving Average
- the reason for the rise in corn prices is the decrease in the EU corn harvest in 2024/25. This is the third consecutive year of poor harvest.
If you have anything to add, please write in the comments.

Bullish time in CORN ahead \o/You can see here the CBOT:ZC1! price displayed in a line chart. After reaching its high in early 2022, the bears took control, driving the price down significantly until now.
The factors in play are as following:
Seasonality: Corn prices have historically shown strength from December through March, aligning with planting and crop cycles. This seasonal trend could provide a solid backdrop for a potential price recovery. (highlighted in green on the chart)
Interest Rates: We’ve reached a pivotal moment in the Federal Reserve's interest rate cycle. The rate hikes that began in March 2022 coincided with the start of the bearish trend, while recent rate cuts in September 2024 may support a rebound in commodity prices, including corn. This shift in monetary policy could act as a bullish catalyst for corn and other commodities. (highlighted in orange on this chart)
Technical Indicators: For additional confirmation, one could wait for a bullish crossover of the moving averages (a golden cross). Such a cross would reinforce the technical setup and definitively signal the onset of a new bull market in corn.
With these factors in play, corn could be setting up for a strong rally in the months ahead.

COT Analysis - Grains ZL & ZCZL & ZC are fundamentally setup for shorts if we get a confirmed daily bearish trend change.
I like ZL more than ZC, for reasons outlined in the video.
Have a good week.

Riding the Corn Swing TradeCBOT:ZC1! LONG trade signal triggered. Price has shaken off weak hands by taking liquidity off the lows. We have now a bullish hammer candle and we just made a higher high on lower timeframe.
DCA entry as close to $400’s
Stop tight at $399
Target mid $430’s

Corn Reversal: Classical 5 bar trend confirmed!Corn CBOT:ZC1! is showing signs of a reversal, and it has confirmed the following:
The daily trend was activated at yesterday's close, with enough momentum to push above 450.
The weekly trend is also active, following a classic five-bar trend pattern, indicating a strong reversal signal.
Once it reclaims 433, it should quickly move toward the first target of 466.
If everything aligns as expected, it could aim for a break of the current trend. For now, it’s important to take it level by level.

COT Analysis - GrainsA very quiet week for COT setups.
This week, Corn is still a setup market for shorts. This video goes into why I am looking to short Corn if I get one of my 3 entry triggers.
Have a great weekend.

15% to 35% Upside Ahead for Corn (Divergence Strategy)Corn recently has had the monthly bullish divergence confirmed with Septembers monthly close. This has major implications for corn, as I anticipate corn to now trade up at least 15% from current prices, up to a max move of approximately 35%. Monthly divergence triggers such as this are signals that the prudent trader must pay attention to. This does not mean I anticipate this market to go straight up from here. However, it does mean that, in my opinion, dips are for buying in the Corn market until we reach these upside targets.
Have a great week.

Can Corn Conquer Climate Change?The global food system is under siege from the escalating climate crisis, and corn, a pivotal commodity, is facing a particularly formidable challenge. Rising temperatures, erratic rainfall patterns, and the increased prevalence of pests and diseases are all conspiring to undermine corn production. This article delves into the intricate relationship between corn and climate change, examining the potential consequences for food security, economic stability, and social well-being.
Beyond the immediate threats posed by climate change, the impacts on corn production can have far-reaching consequences. Reduced yields can lead to price volatility, making it difficult for low-income households to afford basic food staples. This can contribute to food insecurity and malnutrition, particularly in vulnerable populations. Moreover, corn production is a major source of income for many farmers, especially in developing countries. Climate change-induced crop failures can have devastating consequences for rural livelihoods and economic stability.
However, the challenges are not insurmountable. By adopting sustainable agricultural practices, investing in climate-resilient crop varieties, and fostering global cooperation, we can safeguard the future of corn and ensure a more sustainable and equitable food system for generations to come. Climate-smart agriculture, which includes practices like crop rotation, cover cropping, and precision agriculture, can improve soil health, reduce water use, and enhance resilience to climate change. Additionally, breeding for resilience can develop corn varieties that are more tolerant to heat, drought, and pests.
Furthermore, promoting crop diversification can help reduce the risk of crop failures and ensure food security even in the face of climate-related challenges. Governments can also play a crucial role in supporting farmers by providing financial assistance, access to climate information, and investments in agricultural research and development.
In conclusion, the future of corn is inextricably linked to our ability to adapt to a changing climate. By embracing sustainable practices, investing in innovation, and fostering global cooperation, we can ensure that corn continues to play a vital role in feeding the world. It's a call to action, a challenge to rethink our approach to agriculture, and a reminder that the future of food is in our hands.

Corn Futures:Evaluating Seasonal Trends Amidst Market VolatilityAs April unfolds, investors and traders in the corn futures market find themselves at a critical juncture marked by seasonal trends and heightened volatility. Historically, April has been a period of growth in corn prices, driven by various factors including planting intentions, weather conditions, and demand patterns. However, the current landscape presents a complex picture influenced by a myriad of geopolitical, climatic, and logistical disruptions.
While the overall corn production from key sources such as the US, Brazil, Argentina, and Ukraine has remained relatively stable, the market has experienced significant turbulence. Geopolitical conflicts, including trade disputes and tensions in key producing regions, have added layers of uncertainty, impacting supply chains and trade dynamics. Severe weather events, ranging from droughts to floods, have disrupted planting schedules and crop yields, further exacerbating market volatility. Additionally, transport issues, including congestion at ports and logistical bottlenecks, have contributed to fluctuations in day-to-day prices and overall market sentiment.
Amidst this backdrop, market participants are actively seeking long setups, anticipating a potential upswing in corn prices. Historical data indicating seasonal strength in April provides a compelling rationale for such positions. Moreover, underlying factors such as resilient demand from sectors including animal feed, ethanol production, and food processing continue to support a bullish outlook for corn.
However, navigating the corn futures market requires careful consideration of both macroeconomic factors and micro-level dynamics. Traders must remain vigilant in monitoring weather forecasts, geopolitical developments, and supply chain disruptions for timely decision-making. Additionally, leveraging technical analysis tools and risk management strategies can help mitigate the impact of market volatility and optimize trading opportunities.
In conclusion, while April historically heralds a period of price growth in corn futures, the current environment characterized by heightened volatility necessitates a nuanced approach to trading. By combining an understanding of seasonal trends with a comprehensive assessment of market fundamentals and risk factors, traders can position themselves to capitalize on potential opportunities while managing inherent uncertainties.

🔥Corn Returm Bullish Trend🔥The corn market is buzzing with positive signals today , promising strong profit potential for investors. Our assessment is spot on as corn prices are exhibiting a robust recovery trend. Across all key timeframes - 4 hours, 1 day, and 1 hour - the upward trend is evident, presenting golden opportunities for investors to seize.
Particularly noteworthy is the emergence of a compelling Order Block resistance zone on the 1-hour chart. This resistance zone signifies significant illiquidity at a specific price level, highlighting it as an ideal buying point to ride the upward trend.
Based on our in-depth analysis, we strongly believe that this is an opportune moment for investors to initiate long positions in corn. The Order Block resistance zone on the 1-hour chart serves as a key to unlocking near-term profits.
BUY LMT ZCEN24:
Entry: 444''0
STP: 439''6
TP: 458

Corn Prices To Fire Up on Rising Energy CostsIt is official. Inflation is back. But not everywhere. Food inflation is on the decline. All three major crops, Soybean, Wheat, and Corn have declined substantially. Bearish sentiments rings loud across agri with ample supplies combined with solid harvest expectations.
Among crops, corn has fared best. Its prices have not declined as much. Corn outlook is positive given South American supply uncertainty and gasoline linked demand spike.
Corn prices face downside risk from ample supply in the near term. Prices have the potential to spike during later part of the year due to supply uncertainty and higher consumption.
Traders can deploy a calendar spread in CME Corn futures comprising of a short September 2024 Corn Futures (ZSU2024) and a long March 2025 Corn Futures (ZSH2025) to gain from shifting dynamics.
RECORD US CROP WILL SUPPRESS NEAR TERM CORN PRICE
The US produced a record 389.69 million MT of corn last year as per latest USDA figures. Massive production is a result of record high yield of 177.3 bushels per acre.
Globally, corn production in the current marketing year is expected to reach a record 1,227 million MT, due to the US crop last year.
Higher supply is expected to lead to a buildup in ending stocks. Stocks are expected to increase from 302.19 million MT to 318.28 million MT. This represents a buildup of almost 16 million MT.
Ample supplies are a headwind to near term corn prices.
USDA ESTIMATES MAY BE TOO OPTIMISTIC
Global corn production forecasts by USDA may be too optimistic. Upcoming harvests from Brazil and Argentina may spring surprises to the downside.
USDA’s forecast for the Brazil corn crop is currently at 124 million MT. Brazil’s national agricultural agency - CONAB - puts the harvest at 110.9 million MT as per their latest crop survey . The difference stems from USDA’s assumption of higher planted area.
CONAB recently cut its estimate for planted area pointing to lower crop prices dissuading farmers from planting corn. Planting in Brazil is delayed from its usual schedule.
USDA is also optimistic about the Argentinian crop. It reduced its forecast for Argentinian corn by 1 million MT to 55 million MT in the latest WASDE report. However, that is still optimistic given the ongoing spread of spiroplasma disease. Last week, Argentina’s Rosario Exchange slashed corn estimates to just 50.5 million MT from a previous forecast of 57 million MT citing crop loss linked with diseases.
USDA estimates are 18 million MT higher than harvest forecasted by regional agencies across Brazil & Argentina. Corn supplies may end up being much tighter than the USDA is currently forecasting if harvests come softer than anticipated.
ETHANOL PRODUCTION IS LIKELY TO INCREASE CORN CONSUMPTION
USDA increased its forecast for corn consumption for ethanol production by twenty-five million bushels (635k MT) in the latest WASDE report. With gasoline and crude prices on a tear, ethanol blending into gasoline is likely to remain elevated during the coming months driving corn demand.
Sustainable Aviation Fuel (SAF) serves as another source of corn demand in 2024. The Biden Administration is set to release its primary climate model for SAF subsidies under the Inflation Reduction Act in the “very near future”.
While recent reports have stated that the model may be restrictive compared to corn-ethanol industry expectations, the subsidies will undoubtedly drive higher demand for corn-ethanol.
CORN FUTURES CONTANGO IS STEEPENING
Corn Futures term structure has become noticeably steeper over the past three months. Premium for dated contracts have increased. Specifically, corn delivery in later part of 2024 and early 2025 command higher premium.
MARKET METRICS ARE TURNING LESS BEARISH FOR CORN
CME Corn Options positions are currently skewed bullish with a put/call ratio of 0.84. Over the past week, bullish positioning has increased with large call option buildup on June (OZCN4) and December contracts (OZCZ4).
Asset managers have also started to reduce net short positioning on CME Corn Futures since positioning reached its all-time low mid-February.
HYPOTHETICAL TRADE SETUP
South America corn supply remains uncertain even as the US delivers a record harvest. Corn prices will remain bearish in the near term amid ample supplies. Longer term, supply shocks and rising demand has the potential to send corn prices higher. This is evident from steepening contango in CME Corn Futures.
To express the view on corn prices increasing towards the end of the year, traders can establish a calendar spread comprising of short position in September 2024 futures (ZCU2024) and a long position in March 2025 futures (ZCH2025). CME corn futures offer deep liquidity even for contracts in 2025 allowing such calendar spreads to be executed efficiently.
A hypothetical trade setup comprising of the calendar spread consisting of short ZCU2024 and long ZCH2025 also offers margin benefits. The calendar spread position is margin efficient with the entire position requiring margin of just USD 350 as of 15/April/2024.
This position not only benefits from the supply trend but also the seasonal trend in corn prices. Corn prices tend to rise from October through February due to seasonal factors. Between April to September, prices tend to decline. This hypothetical spread is supported by both trends.
• Entry: 1.06185 (ZCH2025/ZCU2024 = 485/456.75 as of 12/April)
• Target: 1.076
• Stop Loss: 1.052
• Profit at Target: USD 323 (Target price = 1.33% higher than Entry => Profit = 1.33% x notional = 1.33% x (485 x Contract Size) = 1.33% x (485 x 5000/100))
• Loss at Stop Loss: USD 225 (Stop level = 0.93% below entry => Loss = 0.93% x notional)
• Reward to Risk: 1.44x
MARKET DATA
CME Real-time Market Data helps identify trading set-ups and express market views better. If you have futures in your trading portfolio, you can check out on CME Group data plans available that suit your trading needs www.tradingview.com
DISCLAIMER
This case study is for educational purposes only and does not constitute investment recommendations or advice. Nor are they used to promote any specific products, or services.
Trading or investment ideas cited here are for illustration only, as an integral part of a case study to demonstrate the fundamental concepts in risk management or trading under the market scenarios being discussed. Please read the FULL DISCLAIMER the link to which is provided in our profile description.

CORN Excellent 4-month buy opportunity.Corn's (ZC1!) price action since the COVID recovery in early 2020 is showcasing an amazing resemblance with the previous full Cycle of 2009 - 2014. This is better illustrated on the 1M (monthly) time-frame. Both started the Bull phase on a roughly +175% rebound on the 17 year Support Zone, topping on a Higher Highs (which was a Bearish Divergence with the Lower Highs of the 1M RSI) and then declined both astonishingly by -51.93%.
This is where the market is at now. In 2014 the price rebounded by +28.78% back above the 1W MA50 marginally and just below the 0.382 Fibonacci retracement level, before resuming the long-term decline to the 17 year Support Zone.
As a result, this presents an excellent 4-month buy opportunity with 506'4 as the Target (+28.78%). Notice also that the 1M RSI is on the exact same level (33.75) as it was on the January 2014 Low, and is reversing.
-------------------------------------------------------------------------------
** Please LIKE 👍, FOLLOW ✅, SHARE 🙌 and COMMENT ✍ if you enjoy this idea! Also share your ideas and charts in the comments section below! This is best way to keep it relevant, support us, keep the content here free and allow the idea to reach as many people as possible. **
-------------------------------------------------------------------------------
💸💸💸💸💸💸
👇 👇 👇 👇 👇 👇

CORN - KEYLEVELS - 2DHere I am neutrally bullish, we see a (possible) double bottom, which if it breaks the next level of resistance, could bring buyers and even greater interest.
On the other hand, we must take into account that this correction is normal for grain, taking into account that the situation in Ukraine has calmed down and grain exports have resumed, thus all that growth since the beginning of the war, has now been closed and completed by a correction.
The price is also decreasing due to the fact that the grain harvest was done in August-September and the stocks are full, but with the time when we get closer to spring, the prices must rise again.

10 Year Corn Projection (potentially)10yr Corn outlook: 1 thought (of many) on the potential course of the corn market for the next 10 years. I feel the job of the current market is to find a price high enough to ration future demand. Could be current price, 8.50, or 9.50. The potential is there for any of those numbers to mark a major swing high for Corn. The higher that mark is nearby, the more corn begins to ration future demand. The low found after a major high is made, could mark an area for the future multi year market structure. The market should remain very sensitive for another few years. Sensitive to world demand and production misses across the globe. There are many climate cycles coming ahead that could add to potential Ag production shortages. **Not a prediction, something to watch**
At some point we return to a tighter, more defined market structure working low prices against the long term uptrend line… 4.50-5.25 ???

🌽 Corn Technical Analysis (GrainStats)Corn Fundamentals ( CBOT:ZCZ2023 )
Corn Harvest Progress 🚜➡️🌽
▓▓▓▓▓▓▓▓▓░░░░░░ 59%
Export Inspections 🚢➡️🌎
437,549 Metric Tons
⬇️ 29,055 Metric Tons week vs. last week
⬇️ 22,514 Metric Tons this week vs. this week last year
⬇️ 370,24 Metric Tons this week vs. 5-year average
Export Sales
16,176,285 Metric Tons (Cumulative, Current Marketing Year)
⬆️ 2,753,396 Metric Tons this week vs. this week last year
Noteworthy News / Themes
🟢 Argentina is behind pace on Corn planting (12% complete)
🟢 US River levels have improved on the Mississippi river (barge freight down)
🟢 Mexico purchased 117,200 metric tons in a flash sales news announcement
🔴 The US still has a +2 billion bushel carryout
🔴 Corn failed to stay above $5.00 futures
🟢 Dry forecast in Argentina
🔴 Wet forecast in Brazil
Corn Technicals
Corn couldn't settle above $5.00 for too long given the ample expected carryout being priced into the market in the middle of harvest. Consider the sales that were sold above $5.00 as a gift to the farmers and we hope farmers prices some bushels.
Outside of this, there really isn't much to say anymore about this market except that after 3 years of a bull market, we're finally getting back to reality and reality in the grain market is quiet.
Watch the following levels for now👇
🟢 Current Upside Target: 5.00
🔴 Current Downside Targets: 4.74, 4.675
