CORN has reached exhaustion (for now)Yellow line is entry;
Stop loss is the red line;
Take profit are the green lines;
Corn

Corn Short OpportunityBias: Downwards
- Monthly pinbar
- Look for price to test the 200 day moving average (red)

Corn Weather Market Losing Steam?
In the ZCZ2019 chart, I see the potential for another leg up however I believe it could retreat down to test the current support line. On 4/30 I bought corn around $3.80 feeling the low had been put in, after a few discomforting days I was correct. Due to delayed plantings and not optimal weather looking forward the market exploded up. I exited this position around the $4.40 range and enjoyed the nice profit, skeptical the market could not bust through the $4.54 price level.
Now that the market has broken through that level of $4.54 I am not adding to a Spec long position, while there is certainly upside potential left, I feel the market will struggle in the coming days and weeks to continue the great run it has displayed over the past weeks. That does not mean I am ready to initiate a short position, I feel the upside potential of 8.5% to the upside is still greater than a potential selloff.
I will be keeping a close eye on the market in the coming days and weeks if we do continue to rise an additional 8.5% and reach $5.00 +/- I will be preparing to enter the market as a bear. I do not forsee a freefall taking place but do see the potential for significant price reductions if we reach these levels. For the time being, I remain patient, sitting on my hands.
**Educational purposes only**

ZC1! - What to expect on the 4hr - CORN FUTURESSo check my last chart to see where I told you what needed to happen to get here. Spoiler alert. I was spot on. Now we have a fresh high and fresh failed to gain. Not a bad place to get short with tight stop just above previous highs. BUT TO TRULY KNOW IF THIS IS THE TOP... you have to lose the high. Look for a close below the last leg that took you up and then get short on the pull back to test that previous local high. This could be the last pullback before the drop, if there are no closes above the top green line. But typically there is a significant pull back after it close below the last leg up and thats usually where I get in on trend reversal signals.


CORNusd CFd ; Long Term Perspective on the up Trend :Third EyeCORNusd CFd ; Long Term Perspective on the up Trend :Third Eye

Corn/USD Bounce UpLooks bullish.. looking forward a retracement into +- 4 $ or emas line after it's challenging the resistance at $ 4.28
Indicator looks bullish, volume is rising rapidly.
DMI : +DMI is rising and -DMI is dropping hard creating a huge range between them, bullish also DMX is rising too.. bullish momentum is increasing
Macd : buy histogram is higher than the previous high.. bullish sign so far.
Volume MA is rising

ZC1! - Corn Futures - What to expect on 2hr.I like when charts show fresh highs, you just let it do its thing till it signals which way its about to go. Looking to get short on this one as its coming up to a nice past resistance level. Not financial advice. Trade safe.

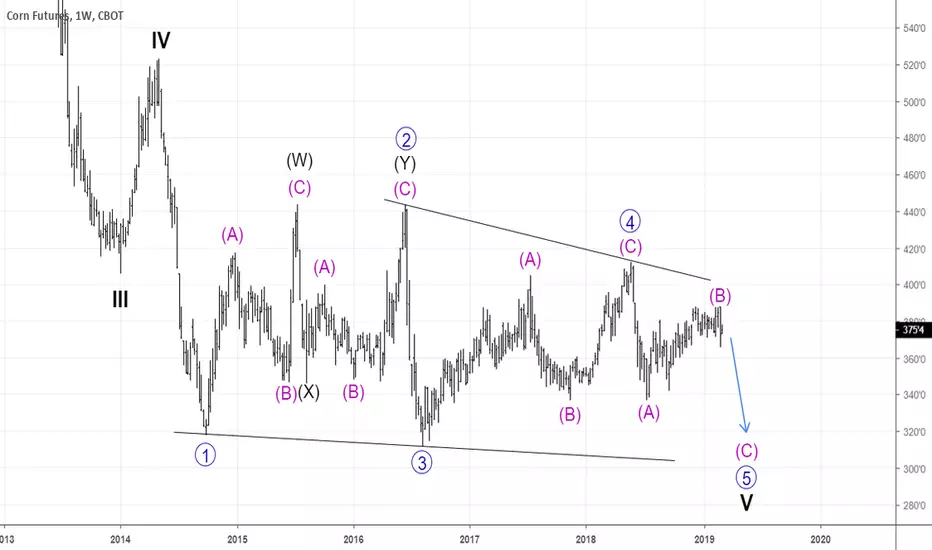
CORN DAILY CHART ANALYSISKey Level: 387’6
I’m working on the idea of triangle wave (B) complete and wave (C) is developing into 5 wave motive structure.
By using Elliot rule of “WAVE 2 never retrace 100% of wave 1”, we can establish an invalidation level that served as our key level of this analysis.
If wave (B) complete, corn has no business to go above 387’8 level and I’m looking forward to short with corn in wave 3.
Let’s see how corn market develop in the next coming days, week and month :D
Please leave a comment if you have any idea and suggestion to improve this corn analysis.
Happy trading


CORN USD BUY (CORN – US DOLLAR)Hi there. Price is forming a continuation pattern to the upside. Wait for the price to hit the bottom of the pattern and watch strong price action for buy.

Corn: Moving sideways on 1W. Short.Corn has been practically neutral on 1W (RSI = 54.490, ADX = 23.173), trading sideways since mid July. With the price currently testing the inner 374'2 Resistance, we consider it to be high enough for a short towards the 0.618 1D Fibonacci = 356'6.

CORN BUYHi there. Price is forming a continuation pattern to the upside. Wait for the price to hit the bottom of the pattern and watch strong price action for buy.
Don’t take a trade if you don’t see clearly when big guys are in.

Corn forecast ZC1!Looks like a possible long setup for the short term, but beware of nearby resistance. Wait for confirmation.
Like this idea if you agree.
Follow me for more tips like this.

ZC1 uptrend resisting Fib levelCorn futures ZC1 have touched the 50% Fibonacci level on three occasions and failed each time. Looking for a reversal to the uptrend

Wheat, Soybeans, and CornWhy Wheat and why now. What about Soybeans and Corn.
Looking across the Ags, it seems that Wheat is enjoying the most upside. Why is this. In keeping with my focus on the DMI and ADX, I think you’d have start by looking at the monthly chart of the 3. One of the key tenants of DMI/ADX is that best trades seem to originate when the ADX is below 20 for an extended period of time. And, for Wheat, that has been since June of 2013. Since then, it has moved between a couple of lines and for the most part, remaining below the 13 period EMA of the high.
As an aside, in my previous articles, I used EMA’s on the close of price but have moved to a 13EMA on high, 26EMA on low and 20EMA on close with the intent to use them as a channel for pullbacks based of ADX action.
June of last year, the downtrend line was sharply broken but before that, the DMI made a significant move when the +/-DI swapped. Although this had happened several time during the past 4 years, what eventually became important is that the low of this candle was never broken while the high was continually tested and broken with the last time starting the recent uptrend. Also, note that during this time that the +DMI continued to make higher highs will not making lower lows. With the ADX moving above 20 in May of this year, a strong signal was given that the market was ready to move up.
Now, consider the same discussion for ]Soybeans :
Notice the size of the candle that caused the last swap. I’ve included a possible consolidation pattern.
And for Corn :
With Corn the interesting thing on recent action is that the DI’s changed dominance but did so where the swap was to -DI but with a green candle. I don’t see this too often but seems to give mixed signals.

Previous Target hit. 1D Channel Down continuation. Short.The TP = 372.20 has been hit and the 1D Channel Down (RSI = 37.956, Highs/Lows = -0.2679, B/BP = -1.4820) continues to deploy on a standard manner. Next TP = 337.20 which is the November 13, 2017 bottom and a very likely candidate for a rebound. If it breaks then 320.40 is next.

Break out point on 1DAfter breaking the 1D Channel Up (Highs/Lows = -12.9821, MACD = -1.170), Corn just bounced off the first important support at 380. We will either see a strong rebound here (long with tight SL, TP = 392.40) or if 379 breaks, it will look for the 372.20 support (TP = 374).


Tiempo de Partiro My horizontal support line and upper bound of the July Channel is being broken as I write this - not surprised and was expecting at least a wick below it. W
What I wasnt expecting is such low volume on this break. I think most of the community is somewhat surprised by the lack of volume, but maybe people are getting smarter. This means lower lows are to be expected - we're gonna break the 2/6 low.
I suspect we hit 6.2k on 4/13 (blue arrow), with a wick going into the 5.5 (green). If a wick breaks that trendline, then I think we will see more bear market down to 4k.

CORN - Strong trend continues...Hi TViewers,
CORN is continuing it's solid trend from it's break above the 3.40(ish) mark and is looking very strong.
As you can see on the chart it has pushed through it's previous minor resistance points at about 3.70 with excellent volume which would lead us to believe it will continue.
We could look to buy here if you weren't already long. Those looking for more assurance could look at the possible crossing of the 50/200 day SMA as entry point. This "Golden Cross" will be a big bullish signal and if it get's solid volume it will be another excellent sign for CORN.
This is not financial advise.
Please don't invest more than you can afford to lose.
Let me know your thoughts in the comments below.

Long Term Corn Buying Opportunity Corn is currently retesting a strong S/R level dating back to 2004. If it holds this will be an excellent long term high R/R long trade setup.
