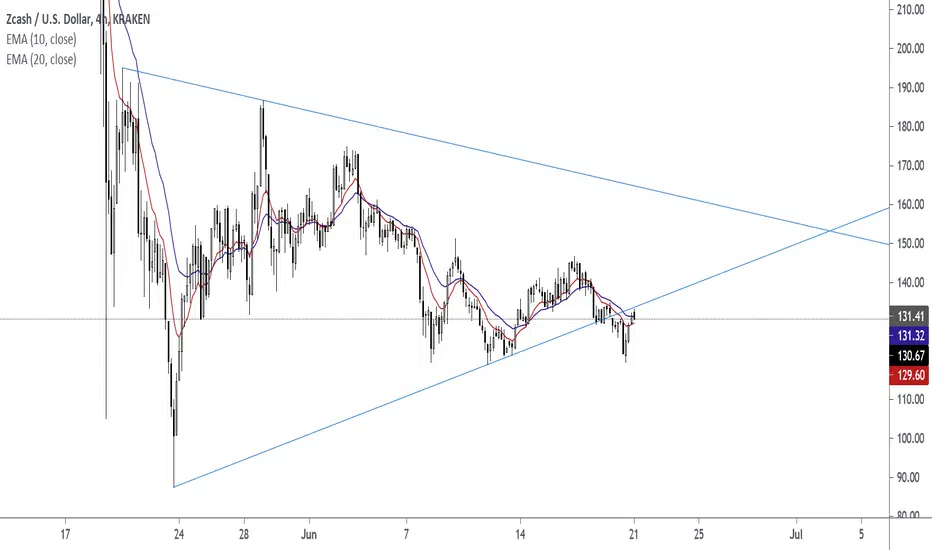
Zcash

buy positionExsit of traiangle
After compression in the corner
Likely rise in August (my brithday)
BINANCE:ZECUSDT

ZCASH optimistic scenarioOptimistic scenario a channel is formed by a large up move
Of course this up move bars pattern is copied from the previous bull move, the only really comparable price action that we are likely to see
three green circles can be viewed as "three up" move
Not a fan of ZCASH but this TA suggests potential.. If you base your buys on TA.

Zcash (ZEC) - July 5Hello?
Welcome, traders.
By "following", you can always get new information quickly.
Please also click "Like".
Have a good day.
-------------------------------------
(ZECUSD 1W Chart)
If the price holds above the 102.42 point, we expect the uptrend to continue.
(1D chart)
If the price is maintained in the 123.08-172.24 range, it is expected to turn into an uptrend.
If it goes down, you should check to see if it finds support in the 98.50-123.08 zone.
If it falls from the 98.50 point, there is a possibility of entering the mid- to long-term investment zone, so you need to trade cautiously.
-------------------------------------
(ZECBTC 1W chart)
If it rises from the 0.002058-0.008700 sideways section and rises to the 0.008700-0.016096 sideways section, it is expected to create a new wave.
(1D chart)
If the price holds in the range of 0.003169-0.003909, it is expected to turn into an uptrend.
In particular, you should watch to see if it is moving along an upward trend line.
If it goes down, you should check to see if it finds support at the 0.002799-0.003169 level.
------------------------------------------
We recommend that you trade with your average unit price.
This is because, if the price is below your average unit price, whether it is in an uptrend or in a downtrend, there is a high possibility that you will not be able to get a big profit due to psychological burden.
The center of all trading starts with the average unit price at which you start trading.
If you ignore this, you may be trading in the wrong direction.
Therefore, it is important to find a way to lower the average unit price and adjust the proportion of the investment, ultimately allowing the funds corresponding to the profits to regenerate themselves.
------------------------------------------------------------ -----------------------------------------------------
** All indicators are lagging indicators.
Therefore, it is important to be aware that the indicator moves accordingly with the movement of price and volume.
However, for the sake of convenience, we are talking in reverse for the interpretation of the indicator.
** The wRSI_SR indicator is an indicator created by adding settings and options to the existing Stochastic RSI indicator.
Therefore, the interpretation is the same as the traditional Stochastic RSI indicator. (K, D line -> R, S line)
** The OBV indicator was re-created by applying a formula to the DepthHouse Trading indicator, an indicator disclosed by oh92. (Thanks for this.)
** See support, resistance, and abbreviation points.
** Support or resistance is based on the closing price of the 1D chart.
** All descriptions are for reference only and do not guarantee a profit or loss in investment.
Abbreviations shown in charts
R: A point or section of resistance that requires a response to preserve profits.
S-L: Stop Loss point or section
S: A point or section where you can buy to make a profit as a support point or section.
(Short-term Stop Loss can be said to be a point where profit and loss can be preserved or additional entry can be made through split trading. It is a short-term investment perspective.)
GAP refers to the difference in prices that occurred when the stock market, CME, and BAKKT exchanges were closed because they are not traded 24 hours a day.
G1 : Closing price when closed
G2: Opening price
(Example) Gap (G1-G2)

Somebody Knows Something Zcash Must Decide Violence or FreedomZcash is taking Halo testnet live in the first week of July
chart can try to out run bitcoin if bulls step in
Zcash is in the Post Halving calm before the storm


Breakout happens at > 0.00555 until then its a crap shoot. volume for the reversal is already poured however its still drying up. rocket ship eventually
its now the most hated crypto currency on Planet Earth

Double bottom at $30 for ZCash. 2-6 months.Im currently biased towards BTC testing $2k to mid 2k's so ZCash seems likely to double bottom around $30-40 (also the ATH for BTC in 2011). ZCash will then have target prices of $900 (neckline) and $3k if double bottom forms. if $1k is breached quickly, we could see $5k-10k Zcash during next bull run.


Zcash (ZEC) - June 16Hello?
Welcome, traders.
By "following", you can always get new information quickly.
Please also click "Like".
Have a good day.
-------------------------------------
(ZECUSD 1W Chart)
If the price holds above the 111.66 point, it is expected that the uptrend will continue.
It is expected to rise above the 239.40 point and create a new wave.
However, it must break out of the downtrend line to create a new wave.
(1D chart)
We need to see if we can move above the 172.24 point by moving up along the uptrend line.
If it goes down, we should see support at the 98.50-123.08 zone and see if it moves along the uptrend line.
The 123.08-172.24 section is an important sideways section, and if it finds support in this section, it is expected to turn into an uptrend.
If it rises to the 221.39-248.97 section, it is expected to re-determine the direction of the trend.
If it doesn't deviate from the downtrend line (2), it's not likely to lead to a big upside and will likely go down, so be prepared for it.
-------------------------------------
(ZECBTC 1W chart)
It must rise above 0.011389 point to create a new wave.
If it rises from the 0.002208-0.007163 section that forms the boxed section, it is expected to create a bullish wave.
(1D chart)
In order to turn into an uptrend, it needs to rise above the 0.003909 point and find support.
We need to see if we can move up along the uptrend line.
------------------------------------------
We recommend that you trade with your average unit price.
This is because, if the price is below your average unit price, whether it is in an uptrend or in a downtrend, there is a high possibility that you will not be able to get a big profit due to psychological burden.
The center of all trading starts with the average unit price at which you start trading.
If you ignore this, you may be trading in the wrong direction.
Therefore, it is important to find a way to lower the average unit price and adjust the proportion of the investment, ultimately allowing the funds corresponding to the profits to regenerate themselves.
------------------------------------------------------------ -----------------------------------------------------
** All indicators are lagging indicators.
Therefore, it is important to be aware that the indicator moves accordingly with the movement of price and volume.
However, for the sake of convenience, we are talking in reverse for the interpretation of the indicator.
** The wRSI_SR indicator is an indicator created by adding settings and options to the existing Stochastic RSI indicator.
Therefore, the interpretation is the same as the traditional Stochastic RSI indicator. (K, D line -> R, S line)
** The OBV indicator was re-created by applying a formula to the DepthHouse Trading indicator, an indicator disclosed by oh92. (Thanks for this.)
** See support, resistance, and abbreviation points.
** Support or resistance is based on the closing price of the 1D chart.
** All descriptions are for reference only and do not guarantee a profit or loss in investment.
Explanation of abbreviations displayed in the chart
R: A point or section of resistance that requires a response to preserve profits.
S-L : Stop Loss point or section
S: A point or section where you can buy to make a profit as a support point or section.
(Short-term Stop Loss can be said to be a point where profit and loss can be preserved or additional entry can be made through split trading. It is a short-term investment perspective.)
GAP refers to the difference in prices that occurred when the stock market, CME, and BAKKT exchanges were closed because they are not traded 24 hours a day.
G1 : Closing price when closed
G2: Opening price
(Example) Gap (G1-G2)

ZEC/USD updateI've updated blue trend lines, orange trend lines and black trend lines
Follow the trend

Long this breakout on Zcash!Orders are set :D Prices in chart. This can be good scalp trade if we break ~38.5$ resistence with solid volume... Do not hold this position too long. Allways use stop loss!!! especially in this market.


It's going to liquidation all longsSince 2017 those holding zec bags have lost 100x in BTC.
Still, i don't think the bottom is clear


ZCash (ZEC) $500+"We foresee a day when the world’s financial systems run on top of and interoperate with Zcash. Just as HTTPS is now ubiquitous, we believe Zcash is uniquely positioned to serve as a foundational layer for a global and digital economy. Among other attributes, this will require privacy, scalability, security and confidence in its foundational economics."
Vitalik Buterin, Ethereum co-founder and Zcash community member
“Halo is a huge step forward for Zcash. A zero-knowledge system without a trusted setup will ensure privacy and future scalability that is available to everyone!”


ZEC Will soon see a breakout!Here's a quick look at ZEC 4 hr chart. As we can see, the price is right now in a symmetrical triangle and we should see a breakout very soon! The volume is very low which indicates a bigger move coming. Keep an eye on this!
My 100x Pick - BonFire token
The idea is: Buy the breakout from the triangle shown in the chart and take profits at the levels shown in the chart.
Targets:
1. 187$
2. 208$
3. 231$
Follow me for daily profitable trading setups
BTC dictates the market. If BTC falls, then Alts will fall as well. Trade safe!

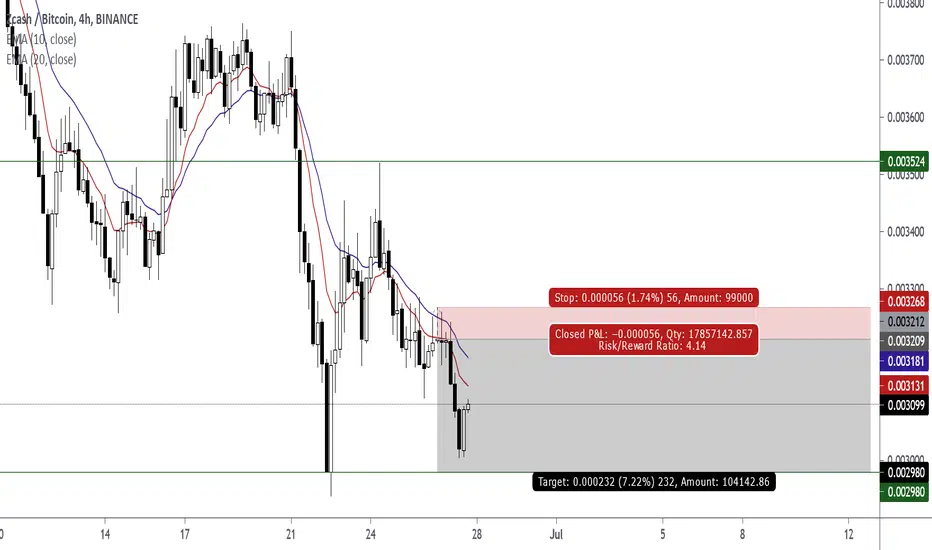
ZEC short term shortWhales aren't done with the shake off, market will dump with btc pullback to 30k

Zcash (ZEC) - May 30Hello?
Welcome, traders.
By "following", you can always get new information quickly.
Please also click "Like".
Have a good day.
-------------------------------------
(ZECUSD 1W Chart)
(1D chart)
You should watch for any movement out of the 141.54-180.46 section.
If it rises above the 180.46 point and finds support, it is expected to lead to an uptrend.
In particular, you should watch to see if it moves along the uptrend line (1).
If it goes down, you should check to see if it finds support at the 128.56-141.54 zone.
If it goes down from 128.56, you can touch the 81.37 3 point, so you need to trade cautiously.
--------------------------------------
(ZECBTC 1W chart)
(1D chart)
We'll have to wait and see if there's any movement out of the 3921 Satoshi-4665 Satoshi section.
If it rises above the 4665 Satoshi point and finds support, it is expected to lead to an uptrend.
If it goes down, we need to see if it finds support in the 3673 Satoshi-3921 Satoshi section.
If it falls from the 3673 Satoshi point, Stop Loss is required to preserve profit and loss.
However, it may follow an uptrend line, so you need to trade cautiously.
--------------------------------------
We recommend that you trade with your average unit price.
This is because if the price is below your average unit price whether the price trend is in an uptrend or in a downtrend, there is a high possibility that you will not be able to get a big profit due to the psychological burden.
The center of all trading starts with the average unit price at which you start trading.
If you ignore this, you may be trading in the wrong direction.
Therefore, it is important to find a way to lower the average unit price and adjust the proportion of the investment, so that the funds that are ultimately profit can be regenerated.
------------------------------------------------------------ -----------------------------------------------------
** All indicators are lagging indicators.
Therefore, it is important to be aware that the indicator moves accordingly with the movement of price and volume.
However, for the sake of convenience, we are talking in reverse for the interpretation of indicators.
** The wRSI_SR indicator is an indicator created by adding settings and options to the existing Stochastic RSI indicator.
Therefore, the interpretation is the same as the traditional Stochastic RSI indicator. (K, D line -> R, S line)
** The OBV indicator was re-created by applying a formula to the DepthHouse Trading indicator, an indicator disclosed by oh92. (Thanks for this.)
** See support, resistance, and abbreviation points.
** Support or resistance is based on the closing price of the 1D chart.
** All descriptions are for reference only and do not guarantee a profit or loss in investment.
Explanation of abbreviations displayed on the chart
R: A point or section of resistance that requires a response to preserve profits.
S-L: Stop Loss point or section
S: A point or section where you can buy to make a profit as a support point or section.
(Short-term Stop Loss can be said to be a point where profit and loss can be preserved or additional entry can be made through split trading. It is a short-term investment perspective.)
GAP refers to the difference in prices that occurred when the stock market, CME, and BAKKT exchanges were closed because they are not traded 24 hours a day.
G1 : Closing price when closed
G2: Opening price
(Example) Gap (G1-G2)

Gradually, then suddenly. Use the dips to accumulate. This is just the warmup. When ZEC is ready for the big show, it will melt faces.
