Miss out on Zcash's last pump? It's not too late. ZEC is a buy today after its fall from grace at $120. Think of this as a second chance to get in cheap! This is a massive buy signal on the daily chart.
Disclaimer:
Not Investment Advice
The information provided by Trading Legacy is for general information purposes only. No information, materials, services and other content provided by Trading Legacy constitutes solicitation, recommendation, endorsement or any financial, investment, or other advice. Seek independent professional consultation in the form of legal, financial, and fiscal advice before making any investment decision.
Zcash


🆓Zcash/USDT Analysis (2/2) #ZEC $ZECZEC has formed a support zone with a Diamond pattern around $86 and ZEC will rise over the next few days. Its targets are $140 and $190 zones this February
📈BUY
-Buy: 84-88$. SL if B
-Buy: 100-105$. SL if B
📉SELL
-Sell: 100-105$. SL if A
-Sell: 135-140$. SL if A
-Sell: 185-190$. SL if A
♻️BACK-UP
-Sell: 84-88$ if B, SL if A
-Buy: 56-60$, SL if B
❓Details
Condition A : "If 1D candle closes ABOVE this zone"
Condition B : "If 1D candle closes BELOW this zone"

ZCASH Possible targets for 2021ZCASH Possible targets for 2021
TARGET1: 220$
TARGET2: 350$
TARGET3: 680$
TARGET4: 2190
The STOPLOSS is dynamic. If the price falls below the stoploss line, it should be exit due to the formation of a wedge pattern.


ZCash (ZEC) one more up leg "invert scale"
Hey trader,
this is the same previous post but in invert scale for visualization in order to see how the waves pattern will look like, and it looks like so familiar that the price might dip (rise) as a high probability! time will tell sooner or later.
the coin since after hitting its ATH price never reversed to any one of the fibo levels so if the reversal happen then expect the 200's levels as a minimum target.
good luck


Zcash (ZEC) • Soon to break historical resistance? There is some FUD around privacy coins with exchanges stop trading it. But is it this enough to stop ZEC breaking resistance into new heights? Let take a look.

ZECUSD a massive bullish setupHey friends, hope you are well, and welcome to the new update on Zcash.
Previously I have posted the article when the price action of Zcash formed a big bullish Gartley and so far it has produced more than 122% rally:
The long-term up-channel:
Now on the weekly chart, the price line of ZEC is moving in an up-channel and reached at the resistance, in the meanwhile, it has broken out the 25, 50, and 100 simple moving averages on the weekly chart as well.
A big bullish Shark move:
Now the price action of ZEC has formed a bigger than the previous Gartley pattern on the monthly chart. the price action cannot enter in the negative zone therefore it is not possible that the price action may move more down up to 1.13 Fibonacci retracement level. The priceline of ZEC has found firm support at $20, therefore it can be considered as a maximum extent of potential reversal zone area.
Big bullish Butterfly:
Zcash with Bitcoin pair on 2-week chart has formed a very big bullish Butterfly pattern and entered in the potential reversal zone. This potential reversal zone is very vast and in the Bitcoin market, the ZEC has no significant long-term support as well, however, it is likely to find a trend line support on the weekly chart. Therefore we should be looking for two major signals to buy the ZEC within the potential reversal zone of this butterfly pattern. First, we can wait for the exponential moving average 10 should cross up the EMA 21 on this weekly chart.
Secondly, we can use look at the Ichimoku cloud on weekly chart and wait for the conversion line to cross up the baseline. After these two major signals, we can place our buying orders in Zcash with the Bitcoin market.
Conclusion:
The price action has formed the biggest harmonic pattern in its history. Therefore there are strong chances that in long-term it will achieve the highest price in its history as well.
For exact buy and sell targets for this trade, and other harmonic trading signals you can join:
www.patreon.com

Zcash formed bit Shark for upto 2250% bullish rallyHi friends hope you are well, and welcome to the new update on Zcash.
On long-term monthly time period chart, the price action of the ZEC has completed the final leg of the bullish Shark pattern and entered in potential reversal zone.The price action cannot enter in the negative zone therefore it is not possible that the price action may move more down upto 1.13 Fibonaicc retracemtn level. The priceline of ZEC has found a firm support at $20, therefore it can be considered as a maximum extent of potential reversal zone area.
Possible profit and loss ratio:
This trade has a huge profit possibility of 2250%, and the loss possibility is 74%.
Note: Above idea is for educational purpose only. It is advised to diversify and strictly follow the stop loss, and don't get stuck with trade.
For exact buy and sell targets for this trade, and other harmonic trading signals you can join:
www.patreon.com

ZECUSD (ZCASH) - INVERSE HEAD AND SHOULDERS PATTERN ANALYSIS 🔎
- ZECUSD is printing the inverse head and shoulders pattern.
- This is a trend reversal pattern.
- It is a bullish pattern.
BUY ENTRY ⬆️
- Breakout above the neckline resistance.
TARGETS 🎯
- Horizontal resistance levels (R1, R2).
SETUP INVALIDATION ❌
- Breakdown below the right shoulder support level (S1).

ZECUSDTZcash have to retest the dynamic resistance plotted in chart after that 2 scenarios will be happening
1- the chart cant break the resistance and chart falls more
2- the chart breaks the resistance and do a pull back then go for more
anyway in short term the chart have to retest the resistance in bullish state

ZEC/USDT/BTCZECUSDT reached 50% Fibonacci and forming a bullish flag.
ZECBTC we break out a global falling wedge and fixed above the support line
The token has been clamped below $ 100 for a long time, I see the potential to break these bullish formations up
Best regards EXCAVO


$ZEC/USDT 3h (Binance Futures) Symmetrical triangle breakoutZcash has broken out of that symmetrical triangle which looks like a bullish pennant.
Current Price= 111.00
Buy Entry= 110.21 - 107.97
Take Profit= 114.58 | 120.69 | 128.97
Stop Loss= 103.60
Risk/Reward= 1:1 | 1:2.11 | 1:3.62
Expected Profit= +10.03% | +21.26% | +36.44%
Possible Loss= -10.03%
Fib. Retracement= 0.786 | 1 | 1.272
Margin Leverage= 2x
Estimated Gain-time= 120h


Zcash: Is volume telling us a story?On OBV: "Granville theorized that volume precedes price. OBV rises when volume on up days outpaces volume on down days. OBV falls when volume on down days is stronger. A rising OBV reflects positive volume pressure that can lead to higher prices. Conversely, falling OBV reflects negative volume pressure that can foreshadow lower prices. Granville noted in his research that OBV would often move before price. Expect prices to move higher if OBV is rising while prices are either flat or moving down. Expect prices to move lower if OBV is falling while prices are either flat or moving up."
On cumulative Delta Volume : " In order to understand what this indicator does, first understand what a “delta” is. Simply put, a delta is the difference between buy and sell volumes within a period/candle. The delta can be positive (buy volume is greater than sell volume), negative (buy volume is less than sell volume), or zero (buy volume is equal to sell volume).The Cumulative Volume Delta (CVD) indicator is based on these deltas. It starts from a user specified origin bar and successively cumulate the deltas. If the CVD line is negative sloping that means more sellers are in action as the demand of the asset wanes. This is usually a sell signal and a trader should search for selling signals. Conversely, if the CVD line is positive sloping, it means that there is more demand for the asset."
Concerning Volume at Price (or market profile): "If the concentration of volume is at the bottom, then this is more likely to be buying volume rather than selling volume. Conversely, if the concentration of volume took place at the top of the bar rather than the bottom, then this is more likely to be selling volume. Volume at price reveals the the concentration of buying and selling at various price levels, which in turn gives us an alternative perspective, not only in terms of momentum, but also in terms of support and resistance. What can we deduce from this analysis? First we can see immediately which of these areas are likely to be significant in the future in terms of resistance and support.
"The preparation of an important move in the market takes considerable time. A large operator or investor acting singly cannot often, in a single day's session, buy 25,000 to 100,000 shares of stock without pushing the price up too much. Instead, he takes days, weeks or month in which to accumulate his line" - Richard Wyckoff
The current Zcash narrative is "the coin that never pumps". But with a very large POC/Value area at historically low price levels, OBV / CVD / volume on the rise-- I believe some large players have been accumulating very slowly and will soon start the mark up phase. Can it test lows again? Sure. If you want to be safe, wait for the breakout above massive VAP platform it's made ($112 would be considered a breakout). I think this coin has a potential to 5x at a minimum. 1 zec=7 btc

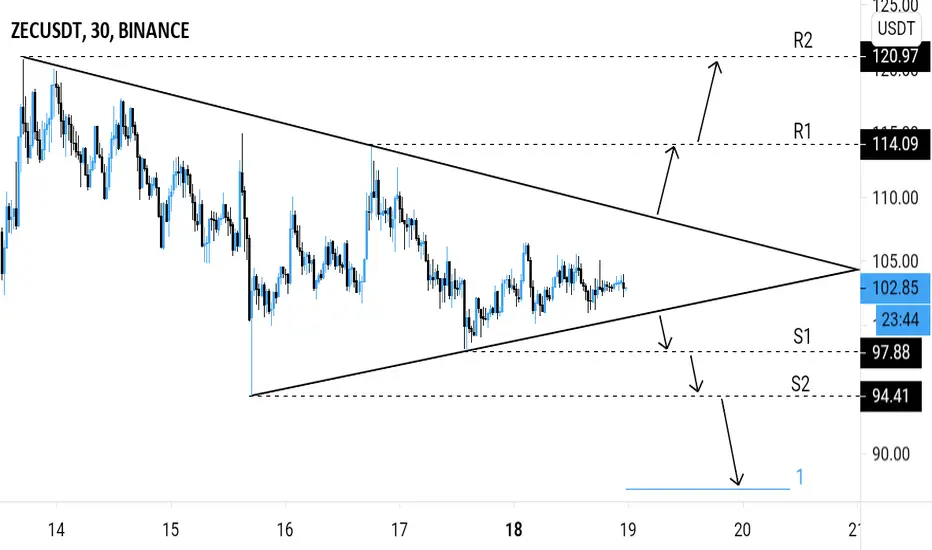
ZECUSDT - Symmetrical triangle Analysis 🔎: ZENUSDT is consolidating in a symmetrical triangle pattern.
Breakout is imminent.
Bullish ⬆️: breakout above the symmetrical triangle's inclined resistance.
Bearish ⬇️: breakdown below the symmetrical triangle's inclined support.
Possible breakout price actions are indicated by the arrows on the chart.
Targets 🎯: Bullish ⬆️ - horizontal resistance levels (R1, R2).
Bearish ⬇️ - horizontal support levels (S1, S2), fibonacci extension levels.
ZEC in a beautiful canalZec is in a very beautiful canal which is very clear. There we are in a triangle or we must wait if it comes out from the bottom or the top.
If it comes out the bottom then TP: $ 75
If it is from the top:
TP: $ 127
And if we break the canal from the top, it's: $152
If you like and want a update please give me : a thumbs up ;)
Good trade for all !

