ZECUSDT ANALYSISIf you have Zcash, enjoy the ride.
If you do not have and planning to buy, you should buy it now because the last candle passed the line(62) so now that line is a support line.
Zcash

ZCASH BUY OPPORTUNITY ? ZEC broke an important resistance
Lot of altcoins pumping everyday, the momentum is really good
We could see a retracement but its overall bullish
Potential +15% and +27% from here

Perfect bearish butterfly #ZECBINANCE:ZECBTC ZEC/BTC making a bearish butterfly with weekly resistance

ZECUSD Exponential Moving AveragesZECUSD
Pin Bar intersects Exponential Moving Averages Dynamic Support Resistance and Horizontal Support Resistance Line.

Zcash: Bullish Trend and How to Join ItWhat do you think about such a long trade?
The price is moving upward in the bullish trend. SMAs support the upward movement, and reversals from them give signals for buying. MACD and DMI are bullish.
We should be ready to see a correction movement below SMA50 to a strong support zone. It is formed by SMA100, SMA200, and 50USd level. The price reversal at this zone will give an opportunity to join the uptrend.
Of course, this trading plan can fail if Bitcoin continues the downward movement and the support zone in this chart won't be able to stop sellers. That's why we have to use the stop orders below the support and don't invest all money in one market.
P.S. as I don't use like-bots and other solutions that show great "interest" to my posts, I will be grateful if you support my work by your LIKEs and comment. Of course, if you can do it. The feedback from REAL people is priceless!
Disclaimer!
This post does not provide financial advice. It is for educational purposes only! You can use the information from the post to make your own trading plan for the market. But you must do your own research and use it as the priority. Trading is risky, and it is not suitable for everyone. Only you can be responsible for your trading.

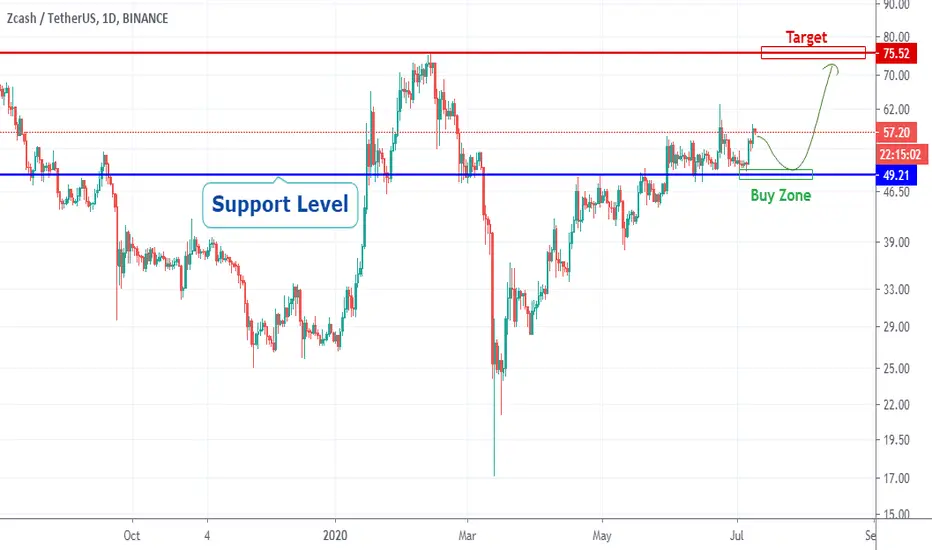
Trading idea on ZEC/USDHello, traders.
Zec recently broke an important resistance level, but the chart looks like it will be sideways for a few more days, so we must pay attention to this important support level to buy this asset.
The target is the next important resistance level.
Will follow BTC next movement, be careful.
Push the like button and follow us on Tradingview.
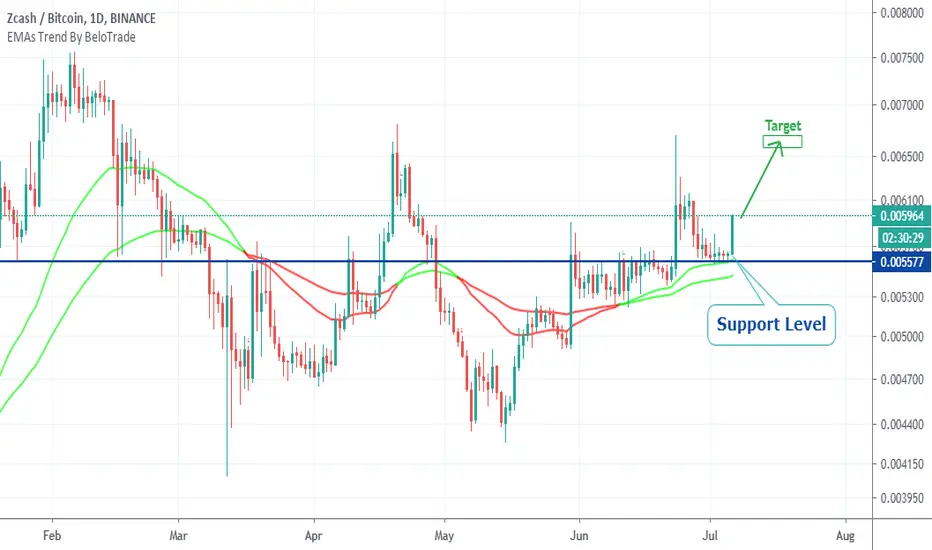
Zcash bullish accumulation pattern above support level.Hello Traders,
Here is a simple and quick analysis for ZEC BTC who made a bullish accumulation pattern above an important support level, our indicator shows us that we still on bullish momentum.
The target is the next important resistance level and stop-loss must go below the support level.
Push the like button and follow us on TradingView.
Zcash (ZEC) Solid Chart, Can GrowZcash (ZECBTC) hasn't been making much 'noise' lately but the chart is pretty solid.
Not "strongly bullish" as most of the charts that I share but solid nonetheless which is still pretty good.
The prices for this pair remains trading above the major MA200 line and also EMA300, as well as the minor ones, EMA10/50/100.
I've kept this chart simple and marked the next main potential path.
Please notice that this just the potential path, surely other scenarios can develop but this is the most probable based on my experience and also the signals coming from the chart.
The dotted lines crossing the charts are for resistance and support.
Resistance = above the current price.
Support = below the current price.
Based on Fib. proportions.
This chart is different from other altcoins and shows real action (people/groups) rather than only trading bots buying and selling.
How do I know this you ask? 😊
Because of the patterns being drawn on the chart.
Thanks a lot for reading.
Namaste.
Previous chart | May 17


Don't miss the great buy opportunity in ZECBTCTrading suggestion:
. There is a possibility of temporary retracement to suggested support line (0.00539). if so, traders can set orders based on Price Action and expect to reach short-term targets.
Technical analysis:
. ZECBTC is in a range bound and the Resumption of uptrend is expected.
. The price is above the 21-Day WEMA which acts as a dynamic support.
. The RSI is at 60.
Take Profits:
TP1= @ 0.00560
TP2= @ 0.00580
TP3= @ 0.00610
TP4= @ 0.00640
SL= Break below S2
❤️ If you find this helpful and want more FREE forecasts in TradingView
. . . . . Please show your support back,
. . . . . . . . Hit the 👍 LIKE button,
. . . . . . . . . . . Drop some feedback below in the comment!
❤️ Your Support is very much 🙏 appreciated! ❤️
💎 Want us to help you become a better Forex trader?
Now, It's your turn!
Be sure to leave a comment let us know how do you see this opportunity and forecast.
Trade well, ❤️
ForecastCity English Support Team ❤️

ZEC BTC BUY (ZCASH - BITCOIN)Hi there. Price is forming a continuation pattern to the upside. Wait for the price to complete the pattern and watch strong price action for buy.


Bullish momentum ZEC/BTC.Hello Traders,
ZCASH seems to be breaking out a bullish accumulation pattern after the long term downtrend line breakout. But be careful this asset is facing a liquidity problem.
As we can see in the image above, this asset is facing a liquidity problem, where it is causing many traps for small players.
I'd rather stay out of an asset like that
But the potential for this asset to rise is very large when looking at the long term


ZEC/USD(WEEKLY), BULL DIV, SHARK PATTERN, 111 TO 155% MOVETHIS IS IN SUPPLEMENT TO MY ZEC/BTC IDEA WHICH I PUBLISHED EARLIER
I AM NOT A FINANCIAL ADVISER, DO YOUR OWN RESEARCH!

ZCash ZEC Breakout Updateprice break the bull flag and price under big symmetrical triangle
Buy : below 56000 and hold ( if symmetrical triangle break than next target 80000
Stop : 5150
Target : 60000 , 70000 ,80000

ZEC/BTC(DAILY), HARMONIC-MANIA! POTENTIAL 47% MOVEI AM NOT A FINANCIAL ADVISER, DO YOUR OWN RESEARCH!

Channel broke to the downside as expected on ZcashTo be fair the move to the downside doesn't look super impulsive so far. Not looking for longs anyway

ZECUSD has strong support of MAs within channelHi friends hope you are well and welcome to the new update on Zcash. Today the ZEC has finally bounced from the support of an up channel where the price action was moving since after the mid of March 2020. I want have also placed exponential moving averages with the time period of 10 and 21 and since the price action has crossed up these EMAs it is using them as support very well. And this time the price action is also likely to use these EMAs as strong support again. I have also placed the moon phases indicator on this chart. On the upside, there are full moons and on the downside, there are dark moons. The new full moon is appeared at the resistance of the channel that is showing that it will be difficult for the price line to cross up this level and the dark moon is appeared at the support of the channel that is a signal that it would be difficult for the priceline to break down the support of this channel. Therefore there are some neutral signals by these indicators appeared on this daily chart.
Bill William’s 3 Lines Indicator and SMAs:
As the price action has bounced from the support of the channel and also likely to bounce from the exponential moving averages as well. However here I have used the Bill William’s 3 lines that is also called Bill William’s alligator indicator as stop loss. This is a very powerful indicator to identify and catch the bearish and bullish trends. I normally suggest not to not to sell the asset or not to take exit unless the price action breaks down these three lines. This indicator contains three moving averages the smallest one is the 5 the other one is 8 and the biggest moving average is 13. The smallest is called lips the middle moving average is called teeth and the biggest time period moving average is called jaw.
Whenever the smallest moving average moves above all the other moving averages and teeth moves to the center and the jaw moves below all other moving averages then it is called an opened alligator mouth that is a bullish single. And whenever smallest moving average moves down below all the other moving averages and the biggest moving average moves above all moving averages then it is called that the alligator mouth is closed and that is a bearish signal.
At this time the bill Williams lines are moving sideways and the price action is also moving sideways with these three lines, however, there is possibility that sometime these three lines give you the false signal. Because these lines are very fast moving averages with the time period of 5,8 and 13. Therefore I suggest to not use this indicator alone, always use this indicator with the combination of some other indicators. For example here I have used the simple moving averages with the time period of 25,50,100 and 200. And whenever the priceline cross down the bill William lines and the alligator mouth gets closed then we should see that whether the price action has broken down the support of the simple moving averages of 25, 50, 100 and 200. I yes then we can take exit from the trade as stop loss. If any of the moving average is saved and not broken then we should wait for the price fine to take bounce from the moving average or otherwise we should consider that the stop loss is triggered.
On the daily chart it can be easily seen that we have received such false signal from 11th May to 15th May 2020 when the price action broke down all 3 Bill William lines and alligator mouth was closed. But if we watch the simple moving averages with the bigger time period on the other chart then the price action was having very strong support of 200 simple moving average. Therefore price action bounced from this simple moving average and started next bullish move.
Bill William Indicator:
Simple moving averages:
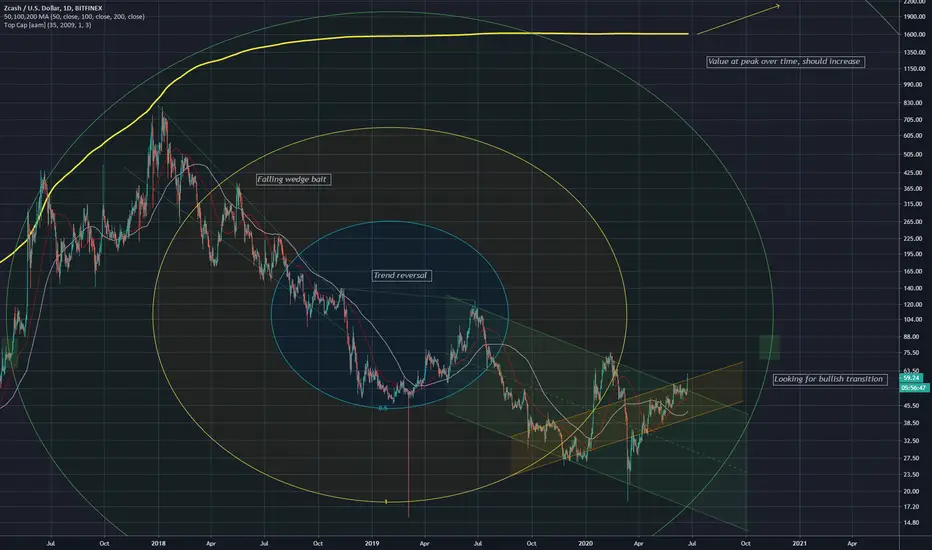
This big bullish Gartley can lead the priceline to achieve the highest price:
now I would like to recall the very big Gartley move that is formed by the price action of Zcash on the monthly chart. I have already shared this pattern in my previous articles as well. At this time ZEC is entered in the potential reversal zone of this pattern and I am expecting that once the price action will cross up the 0.786 Fibonacci projection of A to D leg then it can lead the priceline of Zcash to achieve the highest price ever in the history of ZEC.
Conclusion:
So far the price action of Zcash is giving no clear signals to break out or break down however untill it has strong support of the moving averages it can make more upward moved.

ZEC'S ALIVEZECUSD simple and easy trade.
Support is confirmed and strong. Read to go ahead and test that resistance at 100$
Perfect trade here, low risk reward.
Use stops, be safe.

Fuck zcash mother fucking dog shit coin fuck you1 zec = 7 btc
buying and walking away for 3 months
if this doesnt work out crypto is a scam
but just saying buy scam coins, they pump the hardest
