My Current View For Zcash (Chart Mapped)Here we have the chart for Zcash (ZECBTC).
We have bullish indicators and prices challenging resistance.
The immediate resistance is now EMA200 (0.005663).
ZECBTC will continue to push up until this level breaks.
If not enough momentum can be gathered, prices will retrace before the next try.
We remain bullish even if prices drop below support.
We expect a strong bounce after if such a scenario comes to pass (blue arrow).
Namaste.
Zcash

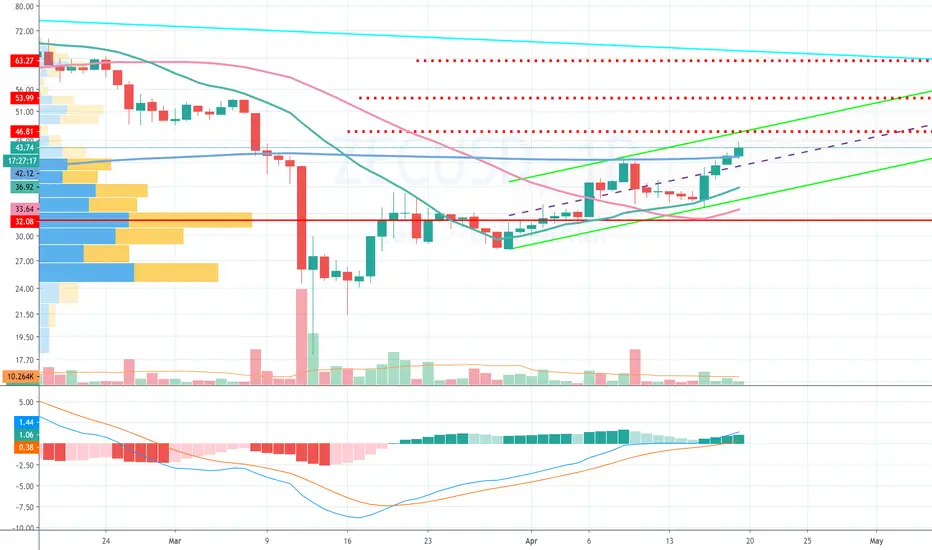
The upward trend of anonymous zcashAs an anonymous coin, it has always been a mixed blessing. Because of anonymity, it is easier to be favored by the dark web, but that is why regulators abhor it. Zech has been flat since it went public. Listing in bitfinex in 2017, adding a brief $2,500, then went all the way to become the leader in zeroing, and one of the top 10 major impairments of 2017. Until there is still 1% left, catch up with the 2108 ico explosion, at one point rebounded from $30 to $800, a full 30-fold increase, is also a model of big ups and downs. But then it continued to bounce back from a sluggish trend, plunging to a record low of $19 at one point in March.
It has now doubled its gain to $44 after a rally. Recently the trend is relatively strong, some say is half the bull market. I think if the half-way bull in Bitcoin had been faked, the others would have been not to mention. Even anonymous currency, you belong to the encrypted digital currency, it is difficult to break through the larger class of encrypted digital currency.
Fundamentals aside, because that's not my specialty, but I'm convinced that charts are all-encompassing.
The price now forms a rising channel, with the pressure level just around 46 superimposed on the pressure line, while the next resistance is $54, and the downward trend line is superimposed on the up 63.
If we look at the technical trend, macd long trend, moving average breakout, rising channel, is a holding signal, if you are holding a position now, consider continuing to hold,Drop below the support level to reduce the position. If you want to enter the market now, I think it may be up to see if you can break through the channel pressure. It doesn't make much sense to gamble for less than 5% of your profits. Trading strategies are based on a balance of security and profitability, which is a bit higher and must be your personal preference. But we can't go beyond the basic logic.


Zcash Falling WedgeZcash is currently in a falling wedge
This in this situation is a bullish continuation pattern
Fib spirals can be used to identify resistance support areas and potential entry points (orange label clear attempt at a support along the fib spiral)

Is Zcash Setting Up The Play?Symbol: ZECBTC
Clear long downward run it has been. But, we have broke out or Resistance and now are seeing the pullback to old Resistance. This could be a new support swing to the upside. No confirmation on my tools yet but I am just using tech. Analysis. Zcash really needs to create a higher high. Will stay updated on this one. Low cap coin / Privacy opt in coin
----------------------------------------------------
Want to level up your trading skills?
We just realesed our new course! Follow our tradingview page and visit the link in our bio if you are looking for new strategy to add to your arsenal.
Also checkout our trading indicator available in the link on our page.
---------------------------------------------------
Thank you for your continued support, God bless.
- Major League Trader

ZEC/BTC - double bottom passed 0.004643 level held the sellers.
from the double bottom can buy an asset I think)
Bitcoin's dominance is dropping. It's the right buy alt to BTC.

Last Call Aboard The Zcash ExpressPack your bags. Kansas is going BYE BYE
So long $33. Nice knowin ya


ZCash (ZECUSDT) short.All description on the chart.
Please, don't forget to like and follow.
Thank you.

Zcash/usd - level sublimation A puncture and fixation over the level would be a buy signal for me.
there will be a clear stop loss.
and in the meantime, without a puncture, there's a chance of going down.
Friends, thanks for your likes and comments!
Good luck with trading!

Zcash: $500 By ChristmasCurrent downtrend shows Zcash hitting $0 by EOY 2020
Such an occurrence is out of the question
Prepare for a breakout sooner than later as smart money seeks out alternative wealth storage vehicles in light of the Federal Reserve's plan, as revealed this morning, to initiate an unlimited asset purchase program

Bulish signals in ZcashHello Traders,
Zcash is giving us many signals that is about to revert its downtrend. First we had a beartrap in an important support level, second it is forming a bullish triangle and third is about to break out a downtrend line at the daily RSI. Therefore, bitcoin cash is a currency to pay attention for the next days.
Please, push like button and follow us on our social medias medias.


ZECUSD Trade Idea | 2020/02/23 | Target Price 43.27349884ZECUSD Parallel Channel. Trade Idea From 2020 February 23

ZEC - Zcash - STRONG BUYZECUSD : STRONG BUY
Analysis Method: Fibonacci & Wave Theory
About Zcash: z.cash
Launched in 2016 by Zooko Wilcox-O’Hearn and based on the Zerocoin protocol, Zcash (ZEC) is a decentralized and open-source privacy-focused cryptocurrency that enables selective transparency of transactions. Zcash transactions can either be transparent or shielded through a zero-knowledge proof called zk-SNARKs. This allows the network to maintain a secure ledger of balances without disclosing the parties or amounts involved. Instead of publishing spend-authority and transaction values, the transaction metadata is encrypted and zk-SNARKs are used to prove that nobody is being dishonest. coinmarketcap.com
Monthly: High/Low
Daily: Fib-Time/Minor Wave 1 & 2
6 Hour: Minor Wave 1 & 2
-Waves %: Extended 3rd
Minor Wave 1: 151%
45 Minute Chart: Micro-Wave
Immediate Target Area: $53-$57
Timeframe: 6 Days
Target Area: $85-$110
TimeFrame: 60 Days
Will update.
-FMW

Z CashI closed my Ethereum Classic trade at $8.39 yesterday. I told you in last post to stay out below $8.40, currently sitting at $8.10
Now what do I have my eyes set on.
I'm going to be watching zcash play out in this wedge.
We could see it breakout and form a right shoulder for about 35% gain.
Now I am scouting for my entry.
Almost the same pattern that ethereum classic broke from.

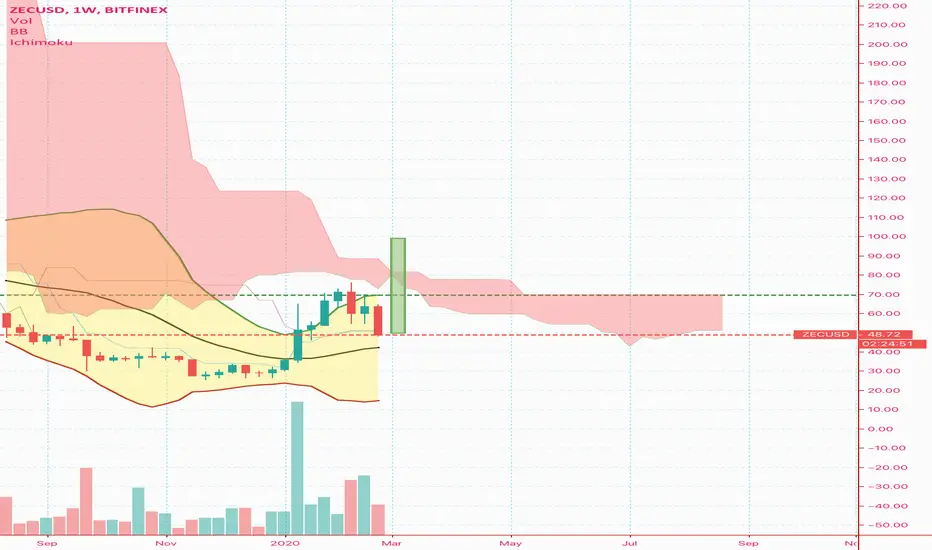
ZCash longZCash have a chance to break out a thin place in ichimoku cloud.
This patterns is usually works on same charts.
ZECUSD forming bullish Cypher | Upto 85% expectedHi friends hope you are well, here I have found another profit potential trading idea for you and this time I have found a harmonic move by Zcash (ZEC). The Priceline of ZEC is forming bullish Cypher pattern and soon it will be entered in potential reversal zone and will be ready for bullish reversal soon.
Lets have a look on the Zcash priceline's move:
After initial leg (X to A) the A to B leg is retraced between 0.382 to 0.618 Fibonacci and then B to C leg is projected between 1.272 to 1.414 of A to X leg's Fibonacci projection and final (C to D) leg is suppose to be retraced between 0.618 to 0.786 Fibonacci projection of X to D leg for a perfect bullish Cypher and then the price action will be entered in potential reversal zone of this bullish Cypher pattern, then we can expect bullish divergence at any time which will lead the priceline between 0.382 to 0.786 Fibonacci projection of C to D leg.
www.tradingview.com
Buying And Sell Targets:
The buying and sell targets according to harmonic Cypher pattern should be:
Buy between: $44.84 to $36.37
Sell between: $51.51 to $67.50
So this is upto 85% profit opportunity
Stop Loss:
The potential reversal zone area which is up to $36.37can be used as stop loss in case of complete candle stick closes below this level.

ZEC / Zcash Bullish divergence and retest - pullback to On the ZEC daily, we’re seeing a bounce on support, although we’re in a downtrend, I expect a pullback to the EMA.
Impulse on the daily is flipflopping between yellow and red, and allows me to trade.
This means that the EMA and/or the MACD Histogram are about to turn up.
We also see some long wicks on the bottom, that seems to show that further going down is rejected.
RSI is crossing up from a totally oversold condition.
On the 4 hour chart, I have a bullish divergence and a retest of this low after that, and then it seems to turn up and going up. That lower retest was also diverging with prices on MACD-H and Elder Force Index.
The stoploss can be placed in the lower wicks we’ve seen before at 49,1. I figure if we after the retesting of the low again again will come down, we probably are going down. Especially with the current bearish background of BTC.
For that same reason, I will tighten the stoploss as soon as I see a new higher low forming on the 4H timeframe, because of these market conditions.
Entry: 51.x
Target: 57.5 to 60.70
Stoploss: 49,1
R/R ratio: 1:3,5 to 1:4,6
