ZEC will guarantee the financial privacy of you and your familyThe cryptography behind Zcash is extremely advanced and allows total privacy. This coin has the potential to become THE world money, by being
1) A medium of exchange
2) A store of value
Recently, the masterminds behind Zcash -- Electric Coin Company -- announced they will to go all-in on $ZEC. electriccoin.co
It's needless to say I strongly believe in this coin, and I'm hodling it.
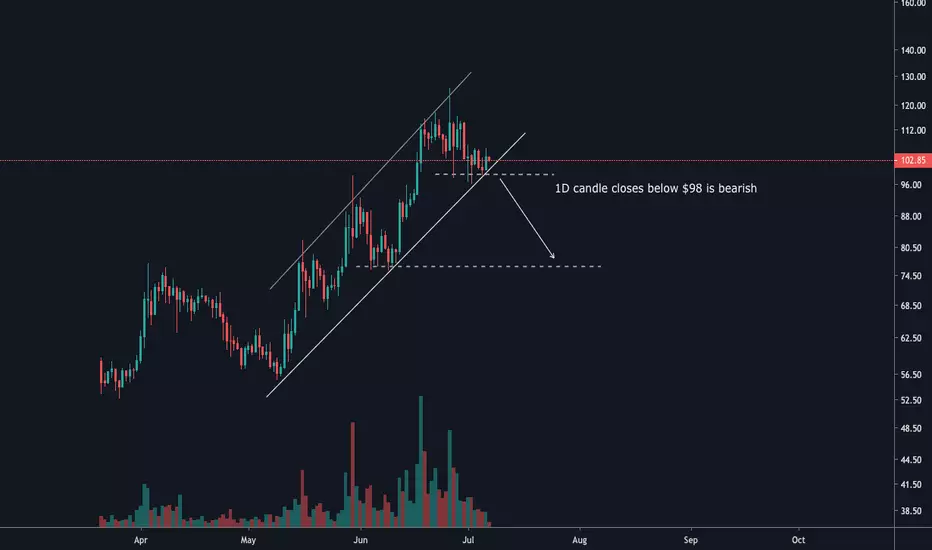
For short term trading, I like to keep things simple : I believe MA200 will be support and from now we will go up.
For long term view, and If you believe in the power of electronic P2P cash, definitely take a look at this coin. These current price are really attractive.
Zcash


ZEC ZCASHUSD on Bonfire Indicator 64°SEE pre-published snapshot below. Upon publishing the scale is thrown off. I see 64 degrees all over the place. docs.google.com

ZEC - Zcash is impulsive don't be afraidZcash looks very impulsive to me at the moment. I wasn't expecting such a fast correction down to the .618 fib retracement level but this could mean we could get a big bounce in the next week or two. August should be a good month for Zcash.


ZcashstrationEither that bullish divergence is gonna play out or im gonna lose some money, its pretty fuckin simple. A smarter entry may be a break of the upper resistance above .0126 but i sure as fuck aint no dam financial adviser.
*This is not a recommendation to 100x long Zcash*

Zec/Btc looking for a bounce on weekly @ 25 RSIBeing all in on Zec since 1 million Satoshi price, I am naturally a little biased. However, there is a bullish divergence on this high time frame Zec/Btc pair. I believe this pair will naturally find a balance at above 2 million satoshis as the zcash halving approaches next fall. Keep in mind how much power and control the Zcash miners have to keep price suppressed. They are generating and controlling 0.1% of additional Zec supply DAILY... Suppressed price means less mining competition, why would the miners want to jack price to the moon on a coin that is already profitable to mine at current price? A moon shot now would only attract more hash rate and give current Zcash miners less power over the distribution. Therefore I believe there is a lot of open market price suppression by miners while whales accumulate via over the counter buys. I will keep adding, I think Zcash is a SOLID project, all the founder reward drama is way over hyped, and the btc pair will return to 5 million sats at some point in the coming years. Might have to suffer seeing 500,000 sats first, but the likelihood of the upside is high given the immense disadvantage of the current stock to flow ratio of Zcash. The supply squeeze next year will be very significant as a percentage of inflation, as annual rate will drop from 33% to 12%.

Zcash Analysis: Intraday timeframe chart patterns Conclusion for today’s Zcash price prediction: A bullish swing is expected to target between 0.010803 and 0.010560.
The 1 hour timeframe of Zencash (ZEN/BTC) is provided in this analysis with major consideration for the current chart patterns and their possible implications. Previous downtrend is highlighted using the bearish trendline that was successfully broken to the upside on June 27, 2019.
ZECBTC has remained in a sideways trend ever since breaking its bearish trendline with a bullish channel (tentative) identified to provide context for price action. The trajectory expected is indicated on the chart and the region of target for the Zencash price prediction is between 0.010803 and 0.010560.
Patience is also required to see what transpires in terms of entering long (buy) position(s).
A close above ~0.009294 can be used as part of the strategy to buy ZECBTC. Alternatively, a successful retest of the lower boundary of the bullish channel at ~0.008936 provides ground for bullish momentum.
A close below the channel’s lower boundary and also below ~0.008671 implies further downside action in ZECBTC.

Zcash USD - Daily NEUTRAL Range Bound, 4HR BULLISH, 1HR NEUTRALZcash USD is Daily NEUTRAL and Range Bound, 4Hour BULLISH, 1Hour NEUTRAL

Zcash ( ZEC ) - 1x or 100% potential profitZcash left accumulation and draw an uptrend ( higher highs and higher lows ) . All impulses are accompanied with good volume
We dont have any strong resistance to our way to 140$ .

ZEC/USD Uptrend Channel with Repeating Triangle PatternsThis is a follow up to the update I posted an hour ago. As shown, there is a clear repeating pattern occurring with a break down from the purple triangles and a later break up from the blue triangles. Following the channel hold which occurred at 106, I expected either a retest of the channel at 107-108, followed by a breakout of the triangle and up towards the 125 region, or an immediate breakout up to the 125 region without a retest.
Of course, any significant downside move by bitcoin could negate this pattern as it tends to drag the market down with it. Therefore, when trading ALTS such as Zcash it is important to always keep an eye on bitcoin too. Nonetheless, the pattern shown here appears very strong and I think it is highly likely that ZEC will soon reach 125.

ZEC/USD Uptrend Channel Holds - Triangle Break May Soon Follow!As predicted in my last analysis, Zcash dropped down from the tight area it was in and found support at the bottom of the channel at the 105-107 area. From here Zcash may continue to bounce around inside the area between the bottom of the channel and the blue triangle before a break above the triangle, or it may simply break above the channel. As before, upon a triangle breakout, a move towards the top of the uptrend channel to around 125 is expected.
Smoking Horsey

ZEC/USD Uptrend Channel Shows Potential Upside in the Near TermZcash is shown to be in a clear uptrend channel (in black). Despite various movements below the channel and into the black dotted area, Zcash has continued to pull back up into and respect the channel. Currently, Zcash is caught in a tight area and may make a small break to the downside with potential support around 105-107 at the bottom of the channel. If support is found there I think it is likely that a break above the triangle (shown in blue) will soon follow. This could see Zcash rally up to the top of the channel at around 125. Alternatively, a triangle break may occur without a retest of the bottom of the channel, sending Zcash up to the top of the channel sooner. Of course, it is important to keep an eye on BTC which is clearly leading the market at the moment. The violent movements bitcoin has made recently has dragged Zcash out of the bottom of the channel before.
Smoking Horsey

Zcash Price Analysis ZEC / USD: Promising Privacy To The WorldFundamental Analysis
Zcash has shown a positive price trend during the last few days. Recently the Electric Cash project announced that it’s planning “to make Zcash usable by 10 billion people by 2050”, which will require a transfer to a completely new chain. The company is considering implementing sharding and making all transactions private by default, in contrast to the 2% of anonymous transactions now.
Zcash / USD Short-term price analysis
Zcash has a bullish short-term trading outlook, with the ZEC / USD pair performing a strong technical bounce from key short-term support.
The four-hour time frame shows that buyers are testing back towards a large bearish reversal candle, that was created on the 26th June. The reaction from this key area should decide the ZEC / USD pair’s short-term fate.
Technical indicators across the four-hour time frame are bullish and continue to generate buy signals.
Pattern Watch
Traders should note that a bearish head and shoulders pattern could start to form if the ZEC / USD pair is rejected from current trading levels.
Relative Strength Index
The RSI indicator on the four-hour time frame is bullish and shows scope for further upside.
MACD Indicator
The MACD indicator on the four-hour time frame is turning bullish, with the MACD signal line crossing higher while the MACD histogram trends in a positive direction.
Zcash / USD Medium-term price analysis
Zcash has a bullish medium-term trading outlook, with the ZEC / USD pair still trading above its breakout point on the daily time frame.
The daily time frame is showing that the bullish breakout still remains valid, with the ZEC / USD pair consolidating above the neckline of a large inverted head and shoulders pattern.
Technical indicators on the daily time frame are mixed and failing to provide a clear trading signal.
ZEC / USD Daily Chart by TradingView
Pattern Watch
Traders should note that the overall upside target of the bullish pattern on the daily time frame will take the ZEC / USD pair towards levels not seen since August 7th, 2018.
Relative Strength Index
The RSI indicator remains bullish on the daily time and continues to trend higher.
MACD Indicator
The MACD indicator on the daily frame remains bullish, although downside pressures are starting to gather.
Conclusion
Zcash is at a critical juncture in the short and medium-term, with the next few trading sessions likely to prove critical for the ZEC / USD pair.
If bulls fail to rally the cryptocurrency to a new 2019 trading high, we could start to see the formation of a bearish pattern on the four-hour time frame and a much deeper bearish correction.

Zec - repeating patterns getting tighter and tighter!Look at how the ZEC/BTC pattern keeps repeating. This is VERY similar to the XRP/BTC fractal correction pattern too. Both are getting tighter and tighter forming, and in my opinion, are winding down before the next huge impulse blast up!

Zcash consolidation faze for more up!Hey guys, Zcash now is in the consolidation, wait for more days then you can buy it for 140- 150usd first target!


Ascending Triangle on ZEC. Nearing apex Simple textbook chart here.
We have an Acending Triangle. Such chart patterns are usually an indicator of bullish continuation. As you see we are nearing the end of the wedge here...the apex. Note: ascending triangles are usually bullish indicators.
#Zcash
I also listed some past bullish patterns which as you can see were prominent in this resulted run.

Zcash Price Analysis ZEC / USD: Y The Fork?Fundamental Analysis
Zcash has been gaining momentum after the release of a new client, which should provide better security for the network.
In April, Ycash announced a “friendly” hard fork which will happen on July 18th and launch a new coin. The Ycash project is independent from both the Electric Coin Company and the Zcash Foundation. Zcash holders will be receiving Ycash, which will likely provoke speculators to buy Zcash prior to the actual hard fork.
Zcash / USD Short-term price analysis
Zcash has a bullish short-term trading outlook, with the ZEC / USD pair probing towards the best levels of the year so far.
The four-hour time frame shows that the recent rally in ZEC / USD pair has invalidated a large head and shoulders pattern, with the breakout move yet to reach its full upside target.
Technical indicators across the four-hour time are conflicted and failing to generate a clear trading signal.
Pattern Watch
Traders should note that the November 14th swing-high is the overall target of the invalidated head and shoulders pattern on the four-hour time frame.
Relative Strength Index
The RSI indicator on the four-hour time frame is bullish and still shows scope for further upside.
MACD Indicator
The MACD indicator on the four-hour time frame is conflicted, with the MACD signal line turning negative while the MACD histogram moves higher.
Zcash / USD Medium-term price analysis
ZCash has a bullish medium-term trading outlook, with the ZEC / USD pair performing a major upside breakout on the daily time frame.
The daily time frame is showing that an upside breakout has occurred from an ascending triangle pattern, with the bullish move yet to reach its full upside objective.
Technical indicators on the daily time frame remain bullish and continue to issue a buy signal.
ZEC / USD Daily Chart by TradingView
Pattern Watch
Traders should note that the upside target of the ascending triangle pattern is also the November 14th, 2018 trading high. If the ZEC / USD pair reaches this target a much larger bullish pattern could form.
Relative Strength Index
The RSI indicator remains bullish on the daily time, although it has moved into extreme overbought territory.
MACD Indicator
The MACD indicator on the daily frame remains bullish and continues to issue a strong medium-term buy signal.
Conclusion
Zcash continues its recent advance, with the cryptocurrency well supported by upside momentum from the strong technical breakouts underway on both time horizons.
At present, all indications points to a pending test of the November 14th swing-high and the potential formation of a much larger bullish pattern.

Zclassic - Falling Wedge - Accumultaion Levelthe support seems to be very strong along the falling wedge, selling pressure is high but not aggressive
bulls have to push the price above 20k sat
good accumulation level for a supergain when beakout!

ZEC is still within the channelZEC is still within the channel while the rest of the alts are losing the base.
I will watch it close here
