Zcash Price Analysis ZEC / USD: Zebra Powered BreakoutFundamental Analysis
Zcash has surged after its partner Parity Technologies announced the release of the alpha version of Zebra, the first Zcash client written entirely in Rust. Zebra exists to provide redundancy in the network and provides additional security in case of failure of the primary client, Zcashd.
Zcash / USD Short-term price analysis
Zcash has an increasingly bullish short-term trading outlook, with the ZEC / USD pair rallying to a fresh 2019 trading high.
The four-hour time frame is showing that a bullish inverted head and shoulders pattern has been triggered, with ZEC / USD bulls invalidating a bearish head and shoulders pattern.
Technical indicators across the four-hour time are still bullish, although they are starting to appear overstretched.
Pattern Watch
Traders should note that the bullish inverted head and shoulders pattern on the four-hour time frame is close to reaching its full upside projection.
Relative Strength Index
The RSI indicator on the four-hour time frame is bullish, although it has now reached overbought conditions.
MACD Indicator
The MACD indicator on the four-hour time frame remains bullish and continues to issue a buy signal.
Zcash / USD Medium-term price analysis
Zcash has a bullish medium-term trading outlook, with the ZEC / USD pair on course for its fifth consecutive day of trading gains.
The daily time frame is showing that a significant technical breakout has occurred, with a large inverted head and shoulders pattern being triggered into action.
Technical indicators on the daily time frame remain bullish and continue to issue a buy signal.
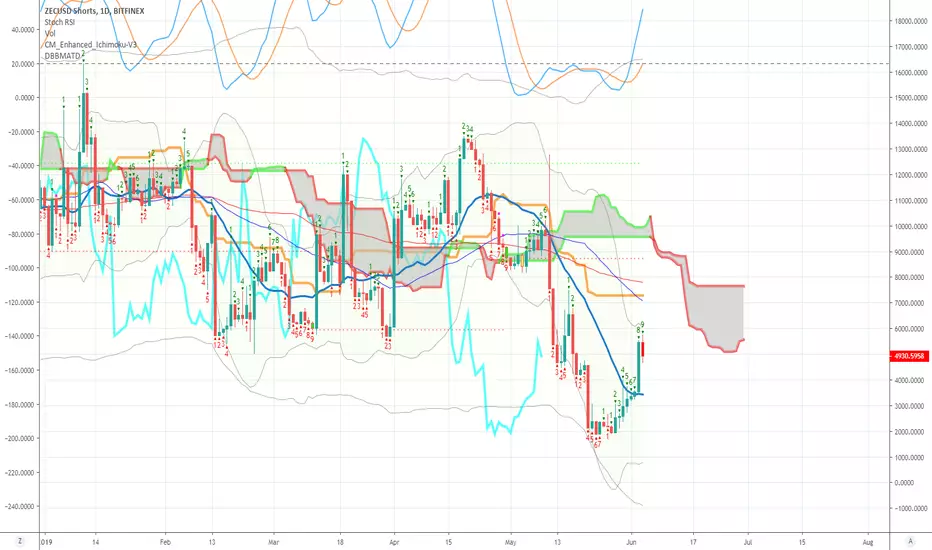
ZEC / USD Daily Chart by TradingView
Pattern Watch
Traders should note that the ZEC / USD pair could rally towards its all-time price high if the bullish pattern on the daily time frame reaches its full upside projection.
Relative Strength Index
The RSI indicator remains bullish on the daily time, although it has moved into extreme overbought territory.
MACD Indicator
The MACD indicator on the daily frame remains bullish and continues to issue a buy signal.
Conclusion
Zcash has performed a major technical breakout on the daily time frame, with bulls finally triggering the large inverted head and shoulders pattern into action.
The cryptocurrency could start to test towards its all-time trading high if bulls keep the recent upside momentum intact.
Zcash

%900 breakout with ycash forkat july 18 zcash will fork with ycash and that will be a great news for zcash. at these days i m excepting a great breakout because free money expecters. my levels are shown at graphich. we will se what will happen...

ZEC - $115 to $93 to $300ZEC is in a perfect setup in my opinion. It is gaining momentum and looks like it will break out of this correction channel. I would expect it to burst above $100 to $115 or so then correct down to touch the top of the channel trendline area, then burst again above to possibly $300 or higher. Very good time for ZEC holders.

Best Time to buy $ZECDo you know about the upcoming Zcash friendly fork? if you didn't know, join to the my sub reddit with the same name.
Time Frame: 1 Day
Support:
a) Trend Line
b) Possible of the golden cross
Resistance ~ 0.013
Enter ~ around the trend line (0.0107)
SL ~ 0.0095
TP ~ 0.015
GL!

ZECBTC (+45%)(+116%) Expecting major ZEC appreciation against BTC over the next few weeks. Tight stop in case BTC doesn't pull back in near term.

ZEC Ready for Another Cycle of short squeezesZcash is on the path to $177.77
Shorts can continue to inflate while being wiped out, Don't get greedy
Zcash Price Analysis ZEC / USD: Renewed InterestFundamental Analysis
Zcash is likely growing in anticipation of the Zcon Annual Privacy Conference which will take place in Croatia on June 22-24, 2019. The event is organized by the Zcash Foundation and will encourage collaboration of privacy projects inside the Zcash ecosystem.
Zcash / USD Short-term price analysis
Zcash has a bullish short-term trading bias, with the ZEC / USD pair still holding price above its 200-period moving average on the four-hour time frame.
The four-hour time frame is showing that a head and shoulders pattern has now formed, with ZEC / USD bulls attempting to invalidate the bearish pattern.
Technical indicators across the four-hour time have turned bullish and are now generating a strong bullish signal.
Pattern Watch
Traders should note that the ZEC / USD pair is once again starting to create higher highs and lower lows on the four-hour time frame.
Relative Strength Index
The RSI indicator on the four-hour time frame is bullish and is currently issuing a strong buy signal.
MACD Indicator
The MACD indicator on the four-hour time frame is bullish, with both the MACD signal line and histogram issuing strong buy signals.
Zcash / USD Medium-term price analysis
ZCash has a bullish medium-term trading outlook, with the ZEC / USD pair edging closer to major breakout resistance on the daily time frame.
The daily time frame is showing that the ZEC / USD pair is consolidating close to the neckline of a large inverted head and shoulders pattern with significant upside potential.
Technical indicators on the daily time frame are now attempting to stage a bullish recovery following a correction from overbought conditions.
ZEC / USD Daily Chart by TradingView
Pattern Watch
Traders should note that if the bullish inverted head and shoulders pattern is triggered on the daily time frame the ZEC / USD pair could rally towards levels not seen since August 2018.
Relative Strength Index
The RSI indicator has once again turned bullish on the daily time frame after briefly dipping towards neutral territory.
MACD Indicator
The MACD indicator is attempting to turn bullish on the daily frame as upside pressure returns.
Conclusion
Zcash is attempting to build upside momentum following a strong reversal from key technical support on the four-hour time frame.
If bulls can invalidate the bearish pattern on the four-hour time frame the cryptocurrency could see a wave of fresh buying interest, which could clear the path for a much-needed technical breakout on the daily time frame.

ZEC is ready at the endZcash (ZEC) has been a mocking subject among the traders, thanks to its tendency to disappoint - or maybe its dumped miners' and founders' reward.
It has a huge inflation rate. But there is one event which might stop this sells for a while:
Ycash Hard Fork.

Zcash/Bitcoin (June 3) #ZEC $ZEC #BTC $BTC#BUY
Current Price : 0.0102
Buyzone : Close to 0.01 as possible
Sellzone : 0.0115-0.0135-0.0150
Stoploss if price is lower than 0.009

ZEC-BTC Long Trade PlanCommodity : ZCASH
Trade Type : LONG
Trading Against : BITCOIN
Entries : Double-UP Entries throughout the Buy Zone
Profit Taking : 25% at each TP point.
Profit Locking : Move SL to break even once TP1 is hit, to TP1 once TP2 hits, to TP2 once TP3 hits and so on
Duration - 1-2 weeks


Zec - new cycle has started, $3900 targetZEC is popping up in lots of news articles lately. This is the beginning of a new cycle showing sentiment is changing. I think Zcash will be viewed one day as the rich man's private coin. Watch for lots of hype around this for the next 1 to 3 years.

ZCash about to pop! Potentially 100 percent return short term!!Good volume and holding trendline. Historically theres little resistance between 90-225. Happy Trading :)

0.010240 needs to break for a long to 0.01252Big timeframe ZEC is really bearish. Atlho i see a long opportunity once we break and close above the 0.010240 level for and upside potential of 20%.
I talked about this coin in our live stream. you can find the live stream in our discord


ZCash - Is there Life after Death?Looking at $ZEC on Binance 3 Day ... is the downward wedge nearing completion for a breakout?


Zcash Price Analysis ZEC / USD: Sharp Bullish BreakoutZcash / USD Short-term price analysis
Zcash has a bullish short-term trading bias, with the ZEC / USD pair advancing to its highest trading level since November 2018.
The four-hour time frame is showing that a bullish breakout has occurred from a neutral triangle pattern, with the move higher yet to reach its full upside target.
Technical indicators across the four-hour time frame have turned bullish and are generating a strong bullish signal.
Pattern Watch
Traders should note that a major range break has also taken place on the four-hour time horizon.
Relative Strength Index
The RSI indicator on the four-hour time frame is bullish, although it has moved into extreme overbought territory.
MACD Indicator
The MACD indicator on the four-hour time frame is bullish, with the MACD signal line and histogram issuing strong buy signals.
Zcash / USD Medium-term price analysis
Zcash has a strong bullish bias over the medium-term, with the ZEC / USD pair performing a major bullish breakout on the daily time frame.
The daily time frame is also showing that bulls have triggered a large inverted head and shoulders pattern, following the continued bullish breakout above the ZEC / USD pair’s 200-day moving average.
Technical indicators on the daily time frame remain bullish and still have scope to trade higher.
ZEC / USD Daily Chart by TradingView
Pattern Watch
Traders should note that the November 14th, 2018 swing-high is the initial upside target of the bullish inverted head and shoulders pattern on the daily time frame.
Relative Strength Index
The RSI indicator is bullish on the daily time frame, although it is now approaching overbought conditions.
MACD Indicator
The MACD indicator on the daily time frame is bullish and continues to issue a buy signal.
Conclusion
Zcash has staged an impressive technical breakout over both time horizons, with the cryptocurrency advancing to a new 2019 trading high.
While the breakout on the four-hour time frame is nearing completion, the bullish breakout on the daily time frame still appears to be in its early stages.


ZECBTCZECBTC T/A
+
Total books: $9,457,036.83 (+1.78%)
Global Bids: $4,765,853.32 (+2.96%)
Global Asks: $4,691,183.51 (+0.59%)


DARPA/Israel/JP Morgan CoinImagine betting against the jews and not accumulating ZEC and BSV, I would kill myself for being a retarded sheep. Enter on break and retest of 69.2. Target is several thousand USD (dead serious).

Zcash - 32000% potentialSome very good news for zcash could bring it back to life which could lead to one of the biggest bull runs ever.
