Daily Bullish Signal $ZEC #ZEC (3 March 2019)RED ARROW indicates the EXPECTED Time and Targets
Level Stoploss point up to maximize profit and reduce risk
I'm working all the time, even in Bearish Market
Zcashbitcoin

Daily Bullish Signal $ZEC #ZEC (09 Feb 2019)BLUE ARROW indicates the EXPECTED Time and Targets
Level Stoploss point up to maximize profit and reduce risk
I'm working all the time, even in Bearish Market


There is a possibility for the beginning of an uptrend in ZECBTCTechnical analysis:
. Zcash/Bitcoin in a range bound and the beginning of uptrend is expected.
. The price is below the 21-Day WEMA which acts as a dynamic resistance.
. The RSI is at 46.
Trading suggestion:
. There is a possibility of temporary retracement to suggested support zone (0.01860000 to 0.01645000). if so, traders can set orders based on Price Action and expect to reach short-term targets.
Beginning of entry zone (0.01860000)
Ending of entry zone (0.01645000)
Entry signal:
Signal to enter the market occurs when the price comes to "Buy zone" then forms one of the reversal patterns, whether "Bullish Engulfing" , "Hammer" or "Valley" in other words,
NO entry signal when the price comes to the zone BUT after any of the reversal patterns is formed in the zone.
To learn more about "Entry signal" and the special version of our "Price Action" strategy FOLLOW our lessons:
Take Profits:
TP1= @ 0.02436000
TP2= @ 0.02830000
TP3= @ 0.03374000
TP4= @ 0.03773000
TP5= @ 0.04364000
TP6= @ 0.05159000
TP7= @ 0.07361000
TP8= @ 0.09137000
TP9= @ 0.10911000
TP10= @ 0.13442000
TP11= @ 0.16666000
TP12 = Free

USDT -ZEC Zcash -Alt Coin Analysis - Point SystemAlt Coin Analysis - Points out of 10
Date : Since 2016 ( 6 / 10 )
Volume 24 H : 14000 BTC -0.17% ( 7/ 10 )
Available Markets* ( 9 / 10 )
Social Media Rate ( 7 / 10 )
Ranks **20 ( 8 / 10 )
Website ( 8 / 10 )
Type private, untraceable cryptocurrency
Overall ( 8 /10 )
I invested heavily for ZCash in Oct 2017 . Result ? My biggest disappointment in late 2017 . However, It is a good time to accumulate some Zcash if you want to create your long term portfolio.
Many altcoins will die in 2018 and We will pump all the survival shitcoins in 2019 with new fresh money. What about Zcash? It will survive in this bear market.
First Target is 200%!
fortune.com
* Considering top 10 crypto exchanges
** Top 100 coins on coin market cap get 10 points

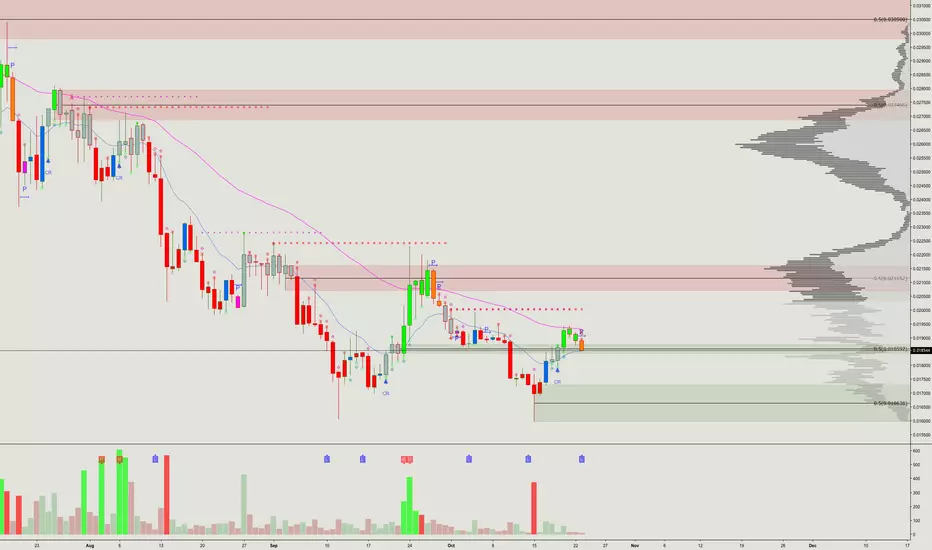
ZECBTCZEC/BTC
Located in the ascending channel
Formed figure double top need to follow the line of the neck
There is also support in the form of the rising channel line
Idicators begin to show bearish signals

Daily Bullish Signal $ZEC #ZEC ZEC/BTC (02 November)Blue Arrow indicates Expected Time and Targets
Follow me for more signals daily

ZEC printing a bearish pivot candle!ZEC moved up nicely off the local bottom but found trouble at the EMA, rejecting and falling back into the demand zone.
A bearish pivot candle has printed so far and if we close this way, we could expect to see further downside, possibly down to the lower demand area before seeing a bounce. Of course, it is still early to jump to conclusions but as we have seen in the past, these pivot candles do lead to some more downside after they close.
Thanks guys!
ZEC pivot of doom? ZEC has been on a tear recently after bouncing off the 0.016 level but has hit a brick wall on its way back up to the supply block around 0.0207.
We still have a CR UP printed on the Daily chart BUT an orange pivot candle seems to have appeared today, which as previously shown, could spell some downside for ZEC here. Obviously, we would need the candle to close like this before getting to any conclusions but this is a warning sign.
The fast-moving EMA has curled upwards but the slow-moving still trends slightly down as it remains resistance.
We currently are sitting right on top of the demand zone so as long as we hold here, we could expect that the uptrend will continue especially with the possible Coinbase listing in the near future.
Thanks guys

ZEC-BTC Binance - bearish divergenceChart is self explanatory. ( I don't like ultra cluttered noob charts with every indicator )
On 4 hr chart we can see a higher high on price action but a lower high on RSI aka - bearish divergence
So you can sell your zcash (if you wish :) and buy back at 0.017428 around 6.5% profit.
Stop loss above 200MA.
Remember this is a swing trade so it may take some time and could get affected by BTC volatality.
If you have any questions ask in comments.
Happy Hunting.
Note- This is not a financial advice trade at your own risk.


ZEC around $95 could be the spot! ZEC popped with the rest of the market early Monday as the crypto market got a resesitation shock. ZEC news recently has been promising and the price hasn't really reflected this, which is normal as we are in a bear market.
We also have the possibility of a Coinbase listing in the near future so picking some up could be a good idea on a dip near the $95 area.
Annotation on the chart!
Thanks guys


There is a possibility for the beginning of an uptrend in ZECBTCTechnical analysis:
. ZCASH/BITCOIN is in a downtrend and the beginning of uptrend is expected.
. The price is below the 21-Day WEMA which acts as a dynamic resistance.
. The RSI is at 40.
. While the RSI and the price downtrend in the Daily chart are not broken, bearish wave in price would continue .
Trading suggestion:
Price is in the support zone (0.01895000 to 0.01610000), traders can set orders based on Daily-Trading-Opportunities and expect to reach short-term targets.
Beginning of entry zone (0.01895000)
Ending of entry zone (0.01610000)
Entry signal:
Signal to enter the market occurs when the price comes to "Buy zone" then forms one of the reversal patterns, whether "Bullish Engulfing" , "Hammer" or "Valley" in other words,
NO entry signal when the price comes to the zone BUT after any of the reversal patterns is formed in the zone.
To learn more about "Entry signal" and the special version of our "Price Action" strategy FOLLOW our lessons:
Take Profits:
TP1= @ 0.02436000
TP2= @ 0.02830000
TP3= @ 0.03374000
TP4= @ 0.03773000
TP5= @ 0.04364000
TP6= @ 0.05159000
TP7= @ 0.07361000
TP8= @ 0.09137000
TP9= @ 0.10911000
TP10= @ 0.13442000
TP11= @ 0.16666000
TP12= Free

ZCASH-BTC Elliott wave analysisAccording to this wave count wave 2 has ended and now its time for wave 3.
ZCASH have a potential to reach very high in next few days.
Happy Hunting

Zcash 50 % profit
Zone buy 170.
First Target: 233 (50 % profit )
2 nd : 360
Stop loss :141 (8% loss)

There is a trading opportunity to buy in ZECUSD Technical analysis:
. ZCASH/DOLLAR is in a downtrend and the beginning of uptrend is expected.
. The price is below the 21-Day WEMA which acts as a dynamic resistance.
. The RSI is at 41.
Trading suggestion:
. There is a possibility of temporary retracement to suggested support zone (164.00 to 142.00). if so, traders can set orders based on Price Action and expect to reach short-term targets.
Beginning of entry zone (164.00)
Ending of entry zone (142.00)
Entry signal:
Signal to enter the market occurs when the price comes to "Buy zone" then forms one of the reversal patterns, whether "Bullish Engulfing" , "Hammer" or "Valley" in other words,
NO entry signal when the price comes to the zone BUT after any of reversal patterns is formed in the zone.
To learn more about "Entry signal" and the special version of our "Price Action" strategy FOLLOW our lessons:
Take Profits:
TP1= @ 199
TP2= @ 227
TP3= @ 261
TP4= @ 304
TP5= @ 377
TP6= @ 492
TP7= @ 560
TP8= @ 800
TP9= Free

$ZCASH #ZCASH - EASY GAINS - BOUNCE coming in soon???Hello Lads and Ladies,
Today we are taking a look at ZSCAHBTC. It is known for a good volatility and has reliable support and resistance lines. Where might it be heading to this time?
Taking a look at the chart, we can see a very huge push for which ZCASHBTC is very known and has done multiple times in its history. depending on where you set the fibs, we are either right now at a 100% retracement or have still a little more until the 100%.
Taking a look at just this one push, we are definitely at a 100% retracement. Anyhow, I decided to put it a little lower because almost ALL of the fibs lines are historically relevant and have been resected multiple times.
I am still confirming that the support that we are sitting right now at (indicated yellow dotted in the chart) is very strong. Being broken the next very crucial support (indicated green in the chart) is around 7% away.
What happened here is rather simple, it pumped straight up and retraced fully, now is the question whether it will retrace even more or push through the downtrend and where will it head to?
I am putting 60% in right now and keeping 40% for the scenario of a further retracement. The reason for this is, that we are at this strong support, retraced by full 100% of the big push and sitting right at the end of the downtrend. RSI is at a point where most of the biggest pushes happened before. As well as I am stoked about the market having a break from blood-bathing for a few days now.
Nevertheless the possibility is still high that this support will not hold and since it has been broken by a little bit due to the whole market dipping, it might continue its journey further down to the next support. A big pump in BTC (which is likely right now) would also help it out reaching this bottom support (green).
Now to the breakouts and pumps. Should ZCASHBTC breakout now, then it would most likely push to the 61.8% fibs line with a possible stop at a weak intermediate resistance. From there on the push MIGHT (little chance) continue towards the previous high.
Should ZCASHBTC continue its downtrend and breakout at the bottom support, it will have a lot of momentum and volume to push very fast to the 61.8% line. Continuing from there without a short retracement will be very hard.
My first buy order is at 0.0275 and the second at 0.0260. The sell orders are set to 0.031 and 0.033. Stop loss at 0.025 and re-buy at 0.02.
Like and Follow me and you will find this page interesting because I am a TA expert and day trader that does daily updates and new posts about the hottest and most discussed coins.
Fell free to request TA for ANY coin you are interested in!!!
Cheers, Tomas

ZCASH SCENARIO ! Traders,
Here we have ZECUSD 4H chart.
This our perv idea about ZCASH
We broke the up main trend-line so we have a recover not reality but it will after touching the bearish trend and continuously making it's destiny bottom.
So our recovery will be on around 315$ and then heading to 200:150$ to make a good entry for all crypto after few weeks it's a positive heading for this market guys! will be understated on Jul.
Regards,
Mohsen

Zcash Mryoshka Doll, Tea & a RocketI hear you, WTH right?
Zcash, an established privacy cryptocurrency providing increased privacy. It's less than 2 years old.
Still a baby in the market place.
The Zcash chart is indicate to me, in regards to pattern formations that we have formed a C&H within a
much larger C&H, not to mention yet another inverted H&S within that. The potential is staggering!
I have tried to draw what I see, dissect each pattern to give you the direction I see this asset moving in.
Tip: Bottom of a cup.
HODL ON -Rocket armed!
Myyroshka (Rusian doll within a doll ).
Patterns within patterns.

Zcash uptrend 100%+ gainZcash was consolidating for a long time since 10th of February till 1 week ago. That would be more than 100 days consolidation.
Now, after longer consolidation and after regaining 50% in 30 mins time on the 14th of May its was more than clear that Zcash is trying to push up.
Made an uptrend from 0.02
Uptrended from 0.0292 touched 0.0456 mark and retraced, but stayed above 0.0282 level and continously pushing upper price level in order to breach 0.045 mark.
After three attempts fails to do it and retraces to 0.0382 (while achieving 0.044 0.045 0.046 prices) and retracing.
Makes an uptrend from 0.0382 while continously retesting that level 5 times (even with strong pierces) didn't managed to breach that level from the upper side.
in the first cycle was uptrending (in sats and usd) more than btc actually lost in value which shows extreme bullishness at this moment (Zcash was uptrending while entire market was between 5 and 20% minus) was like +10% +20%.
Having in mind 0.0382 level held pretty well (desipite numerious retest), my personal take is that Zcash could double or maybe even go to 0.1 target or even 0.015 in last instance (but honestly) i m not expecting reaching that value in one instance.
on 0.082 level we have resistance, but since we are in form of falling wedge, i thing it could actually pierce through 0.045 and 0.056 resistances going straight to 0.082 level which would be next resistance level and (by my opinion) safe exit price for all people who rebuy under 0.04 sats.
Targets :
0.046
0.056
0.082 (as most probable)
0.15 was ATH at zcash (comparing to existant 0.038 we could conclude that price of Zcash is pretty much underpiced.
I do expect sharp upward momentum heading staight to 0.082 sats.
-This is not financial advice, it was meant to be used only as speculative and solely subjective point of view

ZCASH: GEMINI EXCHANGE LISTING: 24 HOURS = 53.25% PROFIT!!!Our " Crypto Bottom" Trade Indicator has correctly identified a buy in point on the 14th of May 2018.
Using this buy in point and selling at today's price, you would have expected to net 53.25% PROFIT!!!
The increase in price may also be explained by positive developments including:
April 14: Zcash releases first Overwinter compatible Zcash release, 1.1.0.
April 16: Zcash company releases list of merchants who accept ZCash.
April 21: Zcash announces that it aims to offer support for the main 3 platforms Windows, MacOS and Linux as a priority.
April 23: BitOasis digital asset trading exchange lists ZCash.
April 25: Guarda, who recently releases a Zcash mobile wallet for Android.
April 26: Dow Jones Marketwatch is announces it is now watching Zcash.
May 2: Goldman Sachs-backed Circle announced its support for Zcash in Circle Invest.
May 10: Zcash makes an investment in StarkWare Industries a new company developing STARKs. STARKs are a new cryptographic proof system which is scalable, toxic-waste-free, and post-quantum secure.
May 14: Gemini Exchange (owned by the Winklevoss Twins) announces it will list ZCash after recieving approval from the New York State Department of Financial Services (NYSDFS). It will commence trading on the May 22 2018.
(NEW) May 15: Reuters publicises Gemini Trust Co exchange listing of ZCash making it the world’s first licensed Zcash exchange.
(NEW) May 18 : Zcash Foundation announced a plan to prioritize ASIC-resistance research.
Analysis reveals that the increase in the price of ZCASH is being driven by it's listing on the Gemini exchange together with the general price recovery in the cryptocurrency markets.
*The "Crypto Bottom SIgnal" used in this analysis is included as part of the Crypto Trade Signals subscription.*
