ZECUSDT Breakout Confirmed - Bullish Rally Loading!BINANCE:ZECUSDT has officially broken above a strong horizontal resistance zone that had been acting as a ceiling for several weeks. The 4H chart clearly shows a breakout with strong bullish candles and consolidation just above the breakout level. a classic bullish retest structure.
This resistance zone had been tested multiple times in the past, making the breakout even more significant. What’s more promising is the clean shift from a range-bound structure to higher highs, supported by a well-defined base of accumulation at the lower support level.
Stay sharp, always manage your risk, and don’t forget to set a proper stop loss. The trend is strong, and momentum is building!
BINANCE:ZECUSDT Currently trading at $44
Buy level : Above $44
Stop loss : Below $39.5
Target 1: $47
Target 2: $53
Target 3: $60
Max leverage 5x
Always keep stop loss
Follow Our Tradingview Account for More Technical Analysis Updates, | Like, Share and Comment Your thoughts
Zec

ZEC Technical Outlook – Can It Reach $80?ZEC Technical Outlook – Can It Reach $80?
Can ZEC reach the $80 level, implying a +60% potential gain? It’s possible — but there are key resistance and support levels to watch closely.
The first major resistance lies around $55, which might be tested soon. However, there is also a possibility of a fake breakout above this level, followed by a short-term correction.
In such a case, price could pull back toward the $40 support zone, which may act as a stronger base for a more sustainable move to the upside.
📈 For now, the trend remains bullish, but price action around $55 will be critical in shaping the next move.
📌 This analysis is for educational and informational purposes only and does not constitute financial advice.
📝 Follow for more updates on ZEC and other crypto assets.

ZEC CAN GO TO $100 TARGET Zec is able to get a confirmation in the coming time frames and to break to $100
Will this be the next break level as omisego did?
We will follow the trend.

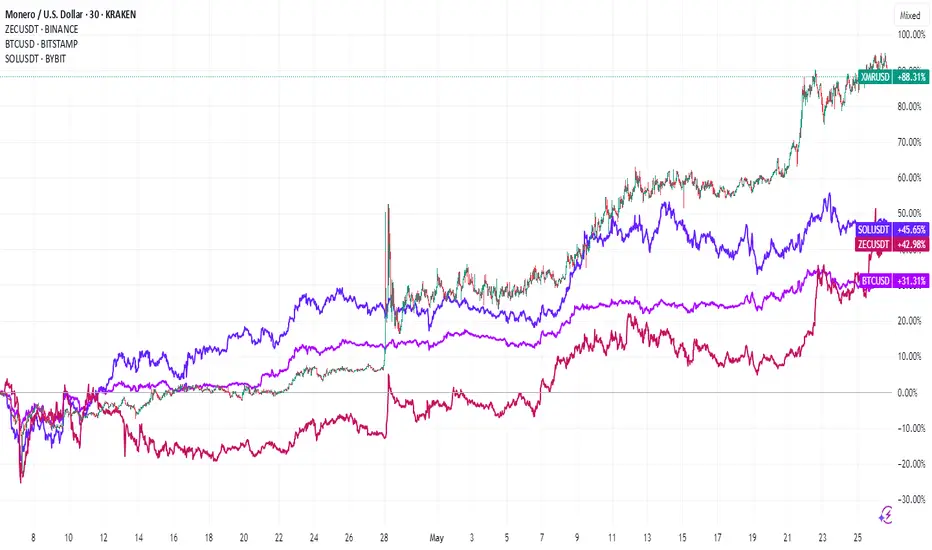
Privacy Coins Surge: Monero & Zcash Lead $10B Rally In the ever-dynamic and often boisterous world of cryptocurrency, where hype cycles can inflate and deflate valuations with breathtaking speed, a particular sector has been making significant strides, albeit with less fanfare than its more mainstream counterparts. Privacy coins, designed with the core tenet of offering users enhanced anonymity and transaction confidentiality, have been steadily gaining traction. Recently, this burgeoning niche has quietly crossed a significant milestone: a collective market capitalization exceeding $10 billion. Spearheading this charge are two of the most established and technologically distinct players in the privacy space: Monero (XMR) and Zcash (ZEC), both of which have recently shown notable activity on price charts, signaling growing investor interest and a potential re-evaluation of their intrinsic value.
The concept of financial privacy is hardly new, yet its application in the digital realm, particularly on inherently transparent blockchains like Bitcoin’s, presents unique challenges. While Bitcoin transactions are pseudonymous (linked to addresses, not directly to real-world identities), the public nature of the ledger means that with enough analytical effort, transactions can often be traced and linked. Privacy coins aim to solve this by employing sophisticated cryptographic techniques to obscure sender and receiver identities, transaction amounts, and other metadata that could compromise user anonymity.
Monero (XMR): The Standard-Bearer for Obligatory Privacy
Monero, launched in 2014, has long been considered one of the most robust and uncompromising privacy coins. Its core philosophy revolves around the principle that privacy should be default and mandatory for all users and transactions. This is achieved through a multi-layered approach to obfuscation:
1. Ring Signatures: This technique allows a sender to sign a transaction amongst a group of other possible signers (decoys pulled from the blockchain), making it computationally infeasible to determine which member of the group actually authorized the transaction. The size of this "ring" enhances the ambiguity.
2. Stealth Addresses: For every transaction, a unique, one-time public address is generated for the recipient. This prevents linking multiple payments to the same recipient address, a common method for deanonymizing users on transparent blockchains.
3. Ring Confidential Transactions (RingCT): Implemented in 2017, RingCT obscures the amounts being transacted. While the network can cryptographically verify that no new coins are being created out of thin air (i.e., inputs equal outputs), the actual values remain hidden from public view.
This combination ensures that Monero transactions offer a high degree of unlinkability (difficulty in proving two transactions are related) and untraceability (difficulty in determining the sender/receiver). This commitment to always-on privacy has made Monero a favorite among those who prioritize true financial anonymity, believing it essential for fungibility – the property where each unit of a currency is interchangeable with any other unit. If some coins can be "tainted" by their transaction history (as can happen on transparent ledgers), true fungibility is compromised.
The recent positive performance of Monero on the charts could be attributed to several factors. There's a persistent underlying demand from users who genuinely require its privacy features. Furthermore, in an environment of increasing discussion around Central Bank Digital Currencies (CBDCs) and heightened digital surveillance, assets that offer an alternative path to financial confidentiality may be seeing renewed interest.
Zcash (ZEC): Optional Privacy with Cutting-Edge Cryptography
Zcash, launched in 2016, takes a different approach to privacy, offering it as an option rather than a default setting. It utilizes a groundbreaking cryptographic technique known as zk-SNARKs (Zero-Knowledge Succinct Non-Interactive Arguments of Knowledge). This allows one party (the prover) to prove to another party (the verifier) that a statement is true, without revealing any information beyond the validity of the statement itself.
In Zcash, this translates to the ability to conduct fully "shielded" transactions. When a transaction moves from one shielded address (a "z-addr") to another, the sender, receiver, and amount are all encrypted on the blockchain, yet zk-SNARKs are used to prove that the transaction is valid according to the network's consensus rules (e.g., the sender had the funds, no double-spending occurred).
Zcash also supports "transparent" addresses (t-addrs), which function similarly to Bitcoin addresses, with all transaction details publicly visible. Users can choose to transact transparently, from transparent to shielded, from shielded to transparent, or fully shielded. This optionality aims to provide flexibility and potentially cater to a broader range of users and regulatory environments, allowing for auditable transparency when desired, while still offering robust privacy when needed.
The recent chart activity for Zcash might reflect growing appreciation for its sophisticated technology and its unique positioning. The development and improvement of zk-SNARKs are at the forefront of cryptographic research, and Zcash is a prime example of their real-world application. As the crypto space matures, there may be an increasing demand for solutions that can offer strong privacy while also providing pathways for selective disclosure or compliance, a balance Zcash aims to strike.
Why the Quiet Surge to $10 Billion?
The collective rise of privacy coins to a $10 billion market capitalization, while "quiet" relative to mainstream crypto narratives, is significant. Several undercurrents could be contributing to this growth:
1. Growing Awareness of Blockchain Transparency: As more individuals and institutions interact with cryptocurrencies, the implications of permanently public ledgers are becoming better understood. High-profile cases of blockchain analysis being used to track funds (for both legitimate and questionable purposes) highlight the lack of inherent privacy in many popular cryptocurrencies.
2. Desire for Financial Sovereignty: For some, the ability to transact privately is a fundamental aspect of financial freedom and sovereignty, akin to using physical cash. Privacy coins offer a digital equivalent.
3. Concerns Over Digital Surveillance: The increasing digitization of finance, coupled with discussions around government-issued digital currencies, has raised concerns about potential mass financial surveillance. This may drive some users towards privacy-preserving alternatives.
4. Maturation of Privacy Technology: The cryptographic techniques underpinning coins like Monero and Zcash have been developed, battle-tested, and refined over several years, increasing confidence in their efficacy.
5. Niche Use Cases: While sometimes controversial, privacy coins serve legitimate niche use cases, such as individuals in oppressive regimes needing to protect their financial activities, or businesses wanting to keep sensitive commercial transactions confidential from competitors.
6. Market Diversification: As the overall crypto market grows, investors may look to diversify into sub-sectors like privacy coins, especially if they perceive them as undervalued relative to their utility or technological innovation.
The "Quiet" Aspect and Lingering Challenges
Despite their technological sophistication and growing market cap, privacy coins operate in a somewhat contentious space, which contributes to their "quiet" ascent.
1. Regulatory Scrutiny: The primary challenge comes from regulators worldwide. Concerns that privacy coins can be used to facilitate illicit activities like money laundering or terrorist financing have led to increased scrutiny. Several exchanges have delisted privacy coins in certain jurisdictions to comply with KYC/AML (Know Your Customer/Anti-Money Laundering) regulations. This regulatory pressure can stifle adoption and create uncertainty.
2. Perception Issues: The association, whether fair or not, with illicit activities has created a perception challenge for the sector. While proponents argue that any financial tool can be misused and that privacy is a fundamental right, this narrative can be difficult to overcome.
3. Complexity: The advanced cryptography involved can make these coins less accessible to the average user compared to simpler cryptocurrencies. Explaining the nuances of ring signatures or zk-SNARKs is more challenging than explaining Bitcoin.
4. Development and Governance: Like all crypto projects, ongoing development, robust governance, and maintaining network security are crucial and require significant resources and community effort.
The Significance of the $10 Billion Milestone
Reaching a $10 billion collective market capitalization is a testament to the resilience and perceived value of the privacy coin sector. It indicates that despite regulatory headwinds and perception challenges, there is a substantial and growing demand for financial privacy in the digital age. While still a relatively small fraction of the total cryptocurrency market, it's a clear signal that a significant number of users and investors believe in the importance of these tools. This milestone provides a degree of validation for the developers, communities, and users who have championed the cause of digital financial privacy.
Future Outlook
The path forward for privacy coins like Monero and Zcash will likely remain complex. They will continue to navigate a challenging regulatory environment, engaging in an ongoing dialogue about the balance between privacy and law enforcement. Technological innovation will be key, not only in enhancing privacy features but also in improving user experience and potentially developing solutions that can address regulatory concerns without compromising core principles (as Zcash attempts with its optional transparency).
Education will also play a vital role – helping the public and policymakers understand the legitimate needs for financial privacy and the capabilities and limitations of these technologies. The debate over financial privacy is far from over, but as Monero and Zcash move up and the sector surpasses the $10 billion mark, it's clear that the demand for confidential transactions is a persistent and growing force in the digital economy. The quiet surge may be a prelude to a louder conversation about the future of money and the fundamental right to privacy in an increasingly interconnected world.
Zcash (ZEC) Explodes 12% Amidst Privacy Coin Rally: Is $300 the With ZEC recovering from $30 to hit $50 and the privacy sector gaining momentum, we delve into the catalysts, challenges, and the bold analyst prediction for Zcash's future.
The cryptocurrency market, a realm of perpetual motion and often unpredictable surges, has recently cast its spotlight on a specific niche that champions user anonymity: privacy coins. Leading this charge, Zcash (ZEC) has registered an impressive 12% gain, a move that has not only gladdened the hearts of its holders but also signaled a broader resurgence in coins designed to obscure transactional data. This rally, which has also seen contemporaries like Monero (XMR) post decent gains, underscores a growing interest or perhaps a renewed appreciation for financial privacy in the digital age.
Zcash, in particular, has demonstrated robust recovery. After languishing at a low of approximately $30 in February, the ZEC token has battled its way back to the significant $50 mark. This psychological and technical level is often viewed by traders as a crucial pivot point. The bullish sentiment is further amplified by a crypto analyst's bold prediction: should Zcash manage a sustained breakout, its price could target an ambitious $300. Such a forecast, while speculative, invites a deeper examination of Zcash's fundamentals, the current market dynamics for privacy coins, and the potential trajectory for ZEC. What exactly is fueling this ascent, and what hurdles might Zcash face on its path to potentially higher valuations?
Understanding Zcash: The Science of Shielded Transactions
To appreciate the current price action and future potential of Zcash, it's essential to understand its core value proposition. Launched in October 2016 by the Electric Coin Company (ECC), spearheaded by Zooko Wilcox, Zcash emerged from the Zerocoin protocol, aiming to address the privacy limitations inherent in Bitcoin. While Bitcoin transactions are pseudonymous (linked to addresses, not direct identities), the public nature of its blockchain means that with enough analysis, transactions can often be traced back to individuals or entities.
Zcash offers a solution through its pioneering use of zk-SNARKs (Zero-Knowledge Succinct Non-Interactive Arguments of Knowledge). This advanced cryptographic technique allows one party (the prover) to prove to another party (the verifier) that a statement is true, without revealing any information beyond the validity of the statement itself. In the context of Zcash:
• Shielded Transactions: Users can send ZEC through shielded addresses (z-addresses). When a transaction occurs between two z-addresses, the sender, receiver, and amount are all encrypted on the blockchain. Zk-SNARKs are used to prove that the transaction is valid (e.g., the sender has sufficient funds, no double-spending) without disclosing the sensitive details.
• Transparent Transactions: Zcash also supports transparent addresses (t-addresses), which function similarly to Bitcoin addresses. Transactions between t-addresses, or between a t-address and a z-address, will have some or all transaction details publicly visible.
•
This optional privacy is a key differentiator for Zcash. Users can choose the level of privacy they require for each transaction. While this flexibility can be seen as an advantage for regulatory compliance and exchange listings, it has also been a point of debate, with some privacy purists arguing that optional privacy is not as robust as mandatory privacy (like Monero's).
The development of Zcash is primarily driven by the Electric Coin Company, with funding initially derived from a "Founder's Reward" where a portion of the block rewards for the first four years was distributed to founders, employees, advisors, and the non-profit Zcash Foundation. This model has since evolved, with community governance playing an increasing role in funding development through new development funds.
The Recent Price Surge: Deconstructing the 12% Jump and the Road from $30 to $50
Zcash's recent 12% price increase is significant not just in its magnitude but also in its context. The climb from a February low of around $30 to the current $50 level represents a more than 66% increase in a relatively short period. This recovery can be attributed to several
interconnected factors:
1. Broader Market Recovery: The entire cryptocurrency market has seen periods of bullish sentiment in recent months. As market leaders like Bitcoin and Ethereum gain, investor confidence often spills over into altcoins, including Zcash. A rising tide tends to lift all boats.
2. Privacy Coin Sector Momentum: There's a discernible trend of renewed interest in privacy coins. Monero, often seen as the flagship privacy coin, has also experienced positive price action. This collective movement suggests a sector-specific catalyst.
o Regulatory Concerns & Censorship Fears: Increased discussions around Central Bank Digital Currencies (CBDCs), financial surveillance, and potential censorship of non-custodial wallets or certain types of transactions may be driving users towards tools that offer greater financial anonymity.
o Geopolitical Instability: In times of global uncertainty or conflict, individuals may seek ways to protect their assets and transact without oversight from potentially unstable or authoritarian regimes. Privacy coins can be perceived as a tool for financial sovereignty.
o Desire for Fungibility: True fungibility means that each unit of a currency is interchangeable with any other unit of the same currency. Bitcoin's transparent ledger means that coins can be "tainted" if they were previously involved in illicit activities, potentially leading to them being rejected by exchanges or merchants. Shielded Zcash aims to provide stronger fungibility.
3. Technical Breakout: The move above key resistance levels on price charts can trigger further buying. For ZEC, overcoming resistance points between $30 and $45 likely attracted technical traders. The $50 mark itself is a significant psychological level. If ZEC can firmly establish $50 as support, it could build a base for further upward movement.
4. Narrative Resurgence: The "privacy narrative" in crypto tends to ebb and flow. It appears to be currently in an upswing, with influencers and media outlets paying more attention to the sector. This increased visibility can attract new investors.
5. Zcash-Specific Developments (Potentially): While not explicitly mentioned in the prompt, ongoing development work by the ECC and the Zcash Foundation, such as improvements to zk-SNARKs (like the Halo Arc upgrade which removed the need for a trusted setup for shielded transactions using the Orchard shielded pool), wallet usability enhancements, or progress on scalability solutions like Proof-of-Stake research, can contribute to positive sentiment over time.
The Analyst's Call: Can Zcash Realistically Target $300?
The prediction that Zcash could target $300 represents a 500% increase from its current $50 level. While such gains are not unprecedented in the volatile crypto market, achieving this target would require a confluence of highly favorable conditions.
Factors that could support such a rally:
1. Sustained Crypto Bull Market: A $300 ZEC is highly improbable without a broader, powerful bull run across the entire cryptocurrency asset class. If Bitcoin were to reach new all-time highs and altcoin season truly kicks in, ZEC could be a significant beneficiary, especially if the privacy narrative remains strong.
2. Major Adoption Catalysts:
o Institutional Interest: If institutions begin to see value in privacy-preserving digital assets, either for their treasuries or for offering privacy-focused financial products, Zcash could attract significant capital inflows.
o Merchant Adoption: Increased acceptance of ZEC (particularly shielded ZEC) for payments would enhance its utility and demand.
o DeFi Integration: If Zcash can be effectively and privately integrated into the Decentralized Finance (DeFi) ecosystem, it could unlock new use cases and demand.
3. Technological Breakthroughs: Further advancements in Zcash's technology that enhance privacy, scalability, or user experience could make it more attractive. For instance, reducing the computational requirements for generating shielded transactions or enabling private smart contracts could be game-changers.
4. Regulatory Clarity (Favorable): This is a double-edged sword. While crackdowns are a risk, clear and favorable regulations that acknowledge the legitimate uses of privacy coins could remove uncertainty and encourage investment. If Zcash's optional privacy model is seen as a compliant way to offer privacy, it might thrive.
5. Weakening of Competitors or Strengthening of ZEC's Unique Selling Proposition: If Zcash can more effectively articulate its advantages over other privacy solutions or if competitors face significant setbacks, ZEC could capture a larger market share.
6. Supply Dynamics: Like Bitcoin, Zcash has a finite supply (21 million coins). As issuance decreases over time due to halvings (Zcash had its first halving in November 2020), reduced new supply coupled with increased demand can lead to price appreciation.
Challenges and Headwinds on the Path to $300 (and Beyond)
Despite the bullish outlook, Zcash faces significant challenges:
1. Regulatory Scrutiny and Delistings: This remains the most significant threat to privacy coins. Governments and regulatory bodies worldwide are wary of technologies that could facilitate money laundering, terrorist financing, or tax evasion.
o FATF "Travel Rule": The Financial Action Task Force (FATF) guidelines require virtual asset service providers (VASPs) like exchanges to collect and share sender and receiver information for transactions above a certain threshold. This is difficult to implement for inherently private transactions.
o Exchange Delistings: Several major exchanges have delisted Zcash (especially its shielded functionality) or restricted its trading in certain jurisdictions due to regulatory pressure or an abundance of caution. Further delistings would severely impact liquidity and accessibility.
2. Competition: The privacy coin space is competitive.
o Monero (XMR): Monero uses a different approach (ring signatures, stealth addresses, RingCT) to provide mandatory privacy. It has a strong community and is often favored by privacy advocates for its "always-on" privacy.
o Newer Privacy Technologies: Other projects are exploring different privacy solutions, including Layer 2 privacy protocols on more scalable blockchains (e.g., zk-rollups on Ethereum that can offer privacy).
3. The "Optional Privacy" Dilemma: While intended as a feature for flexibility, Zcash's optional privacy means that the actual "anonymity set" for shielded transactions (the number of other shielded transactions yours is mixed with) can be smaller if most users opt for transparent transactions. This can, in theory, make shielded transactions less private than if privacy were mandatory and universally adopted on the network. The Zcash community and developers are actively working to encourage greater shielded adoption.
4. Perception and Misinformation: Privacy coins are often unfairly associated solely with illicit activities. Overcoming this negative perception and highlighting legitimate use cases (e.g., protecting commercial trade secrets, personal financial security, dissidents in oppressive regimes) is an ongoing challenge.
5. Scalability and Usability: While zk-SNARKs are powerful, generating shielded transactions has historically been more computationally intensive than transparent ones, leading to slower transaction times or higher fees on less powerful devices. Significant strides have been made with upgrades like FlyClient and the Orchard shielded pool, but continuous improvement is needed for mass adoption.
6. Development Funding and Governance: Ensuring sustainable funding for ongoing research, development, and ecosystem growth is crucial. The Zcash community's ability to effectively govern and allocate resources from its development fund will be key to its long-term success.
What Next for ZEC? Key Areas to Watch
Given the current momentum and the ambitious price targets, several factors will determine Zcash's trajectory:
1. Shielded Adoption Rate: The most critical internal metric for Zcash is the proportion of transactions that are shielded. Increased shielded usage strengthens the network's privacy guarantees and demonstrates the utility of its core technology. Initiatives like the ECC's focus on wallet usability for shielded transactions are vital.
2. Regulatory Developments: Any news related to regulations concerning privacy coins will heavily impact ZEC. Investors should closely monitor pronouncements from major regulatory bodies (SEC, FATF, European regulators, etc.).
3. Technological Roadmap Execution: The successful implementation of planned upgrades, particularly those related to scalability (like potential Proof-of-Stake implementation, which the ECC is researching), interoperability, and enhanced privacy features, will be crucial. The Zcash community recently approved a new roadmap focusing on making Zcash a proof-of-stake chain and introducing Zashi, a new Zcash-focused wallet.
4. Exchange Landscape: The willingness of major exchanges to continue listing ZEC and support its shielded withdrawals/deposits is paramount for liquidity and accessibility. Any new listings or, conversely, delistings will be significant market-moving events.
5. Broader Crypto Market Sentiment: Zcash's fate is still largely tied to the overall health of the cryptocurrency market. A sustained bear market would make significant price appreciation very difficult, regardless of Zcash's individual merits.
6. Institutional Narrative: If a narrative emerges where institutions begin to value or require on-chain privacy for certain operations, Zcash could be well-positioned if it can navigate the regulatory complexities.
7. Community Engagement and Development Activity: A vibrant and active community, along with consistent development contributions, signals a healthy project. Tracking developer activity, community discussions, and governance proposals can provide insights into the project's long-term viability.
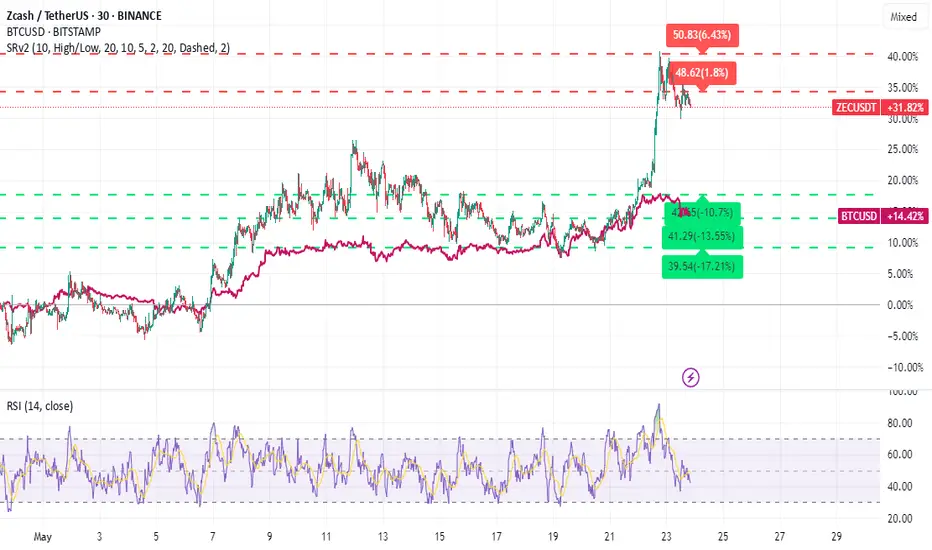
Technical Analysis Snapshot (Hypothetical)
While a deep dive requires real-time charts, here's a general technical outlook based on the described price action:
• Current Level ($50): This is a key psychological and potential resistance/support level. A sustained break above and holding this level as support would be bullish.
• Next Resistance Levels: If $50 is overcome, traders would look for previous swing highs or Fibonacci extension levels. These could be in the $60-$70 range initially, then potentially $90-$100 (a previous significant area of activity for ZEC).
• Support Levels: If ZEC fails to hold $50, previous resistance levels around $40-$45 might act as support, followed by the $30 low.
• Moving Averages: Traders will watch if ZEC can stay above key moving averages (e.g., 50-day, 200-day). A "golden cross" (50-day MA crossing above 200-day MA) would be a strong bullish signal.
• Volume: Increased trading volume accompanying price rises is a sign of strong buying interest and validates the move.
• Relative Strength Index (RSI): An RSI moving into overbought territory (>70) might suggest a short-term pullback is due, but in strong uptrends, assets can remain overbought for extended periods.
The analyst's $300 target would likely involve breaking through multiple significant resistance zones established during previous bull markets.
Conclusion: Cautious Optimism for Zcash in a Privacy-Aware Future
Zcash's recent 12% price jump and its recovery to $50 are encouraging signs for the project and the broader privacy coin sector. The renewed interest in financial privacy, coupled with a generally improving crypto market, provides a favorable backdrop. The analyst's $300 price target, while ambitious, highlights the explosive potential that well-positioned altcoins can exhibit during strong bull cycles, especially those with unique and compelling technology.
However, the path forward for Zcash is fraught with challenges, predominantly regulatory uncertainty. The very feature that gives Zcash its value – privacy – is also its greatest vulnerability in the eyes of many global regulators. The project's ability to navigate this complex landscape, potentially by emphasizing its optional privacy as a compliant solution or by fostering a decentralized ecosystem resilient to censorship, will be paramount.
Investors and enthusiasts should monitor the adoption of shielded transactions, the progress on Zcash's technological roadmap (including the move to Proof-of-Stake and Zashi wallet development), the evolving regulatory environment, and the overall health of the crypto market. While $300 remains a speculative target, Zcash's robust technology and the enduring human desire for privacy ensure it will remain a significant and closely watched player in the digital asset space. The "what next" for ZEC will be a dynamic interplay between technological innovation, market sentiment, and the global conversation around financial privacy and freedom.
"ZEC Analysis" (Update)Finally, this pattern was broken and had a positive impact, leading to significant growth. Now, with a slight price correction, higher price levels can be reached.
PREVIOUS ANALYSIS
Stay Awesome , CobraVanguard

Support and Resistance Zone: 42.19-44.57
Hello, traders.
If you "Follow", you can always get new information quickly.
Please click "Boost" as well.
Have a nice day today.
-------------------------------------
(ZECUSDT 1D chart)
The key is whether the price can be maintained above the M-Signal indicator on the 1M chart.
To do that, we need to see if we can get support around 42.19-44.57.
-
If the price is maintained above the M-Signal indicator on the 1M chart,
1st: 49.89
2nd: 70.62-73.20
We need to respond depending on whether there is support around the 1st and 2nd above.
-
If it goes down, you should check for support around 32.27-33.18.
-
If the price stays above the M-Signal indicator on the 1M chart, it is likely to continue to rise in the medium to long term, so the movement from the current position is important.
Therefore, if you want to trade ZEC, you should focus on the current movement.
-
Thank you for reading to the end.
I hope you have a successful trade.
--------------------------------------------------
- This is an explanation of the big picture.
I used TradingView's INDEX chart to check the entire range of BTC.
I rewrote the previous chart to update it while touching the Fibonacci ratio range of 1.902(101875.70) ~ 2(106275.10).
(Previous BTCUSD 12M chart)
Looking at the big picture, it seems to have been following a pattern since 2015.
In other words, it is a pattern that maintains a 3-year bull market and faces a 1-year bear market.
Accordingly, the bull market is expected to continue until 2025.
-
(Current BTCUSD 12M chart)
Based on the currently written Fibonacci ratio, it is displayed up to 3.618 (178910.15).
It is expected that it will not fall again below the Fibonacci ratio of 0.618 (44234.54).
(BTCUSDT 12M chart)
I think it is around 42283.58 when looking at the BTCUSDT chart.
-
I will explain it again with the BTCUSD chart.
The Fibonacci ratio ranges marked in the light green boxes, 1.902 (101875.70) ~ 2 (106275.10) and 3 (151166.97) ~ 3.14 (157451.83), are expected to be important support and resistance ranges.
In other words, it seems likely to act as a volume profile range.
Therefore, in order to break through this section upward, I think the point to watch is whether it can rise with support near the Fibonacci ratios of 1.618 (89126.41) and 2.618 (134018.28).
Therefore, the maximum rising section in 2025 is expected to be the 3 (151166.97) ~ 3.14 (157451.83) section.
To do that, we need to look at whether it can rise with support near 2.618 (134018.28).
If it falls after the bull market in 2025, we don't know how far it will fall, but considering the previous decline, we expect it to fall by about -60% to -70%.
So, if the decline starts near the Fibonacci ratio 3.14 (157451.83), it seems likely that it will fall to around Fibonacci 0.618 (44234.54).
I will explain more details when the downtrend starts.
------------------------------------------------------

"ZEC Analysis" Currently, ZEC is forming an ascending triangle, indicating a potential price increase. It is anticipated that the price could rise, aligning with the projected price movement (AB=CD).
However, it is crucial to wait for the triangle to break before taking any action.
Give me some energy !!
✨We spend hours finding potential opportunities and writing useful ideas, we would be happy if you support us.
Best regards CobraVanguard.💚
_ _ _ _ __ _ _ _ _ _ _ _ _ _ _ _ _ _ _ _ _ _ _ _ _ _ _ _ _ _ _ _
✅Thank you, and for more ideas, hit ❤️Like❤️ and 🌟Follow🌟!
⚠️Things can change...
The markets are always changing and even with all these signals, the market changes tend to be strong and fast!!

ZECUSDT 1WZEC ~ 1W Analysis
#ZEC Buy gradually from here if you still have a Conviction on this coin with a short -term target of at least 20%+.

ZEC: The Binance Drama#Zcash withdrawals on the ZEC network have been suspended on Binance for weeks, raising concerns especially with also it being in their monitoring list.
Technically, ZEC remains weak below $74.4. A drop below $17.7 to a new ATL could come before a major bullish reversal.
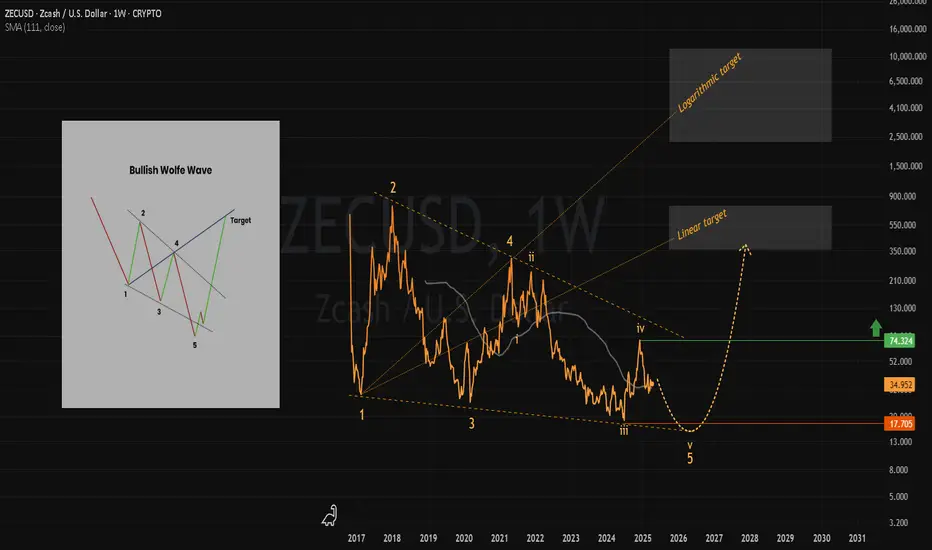
Zcash: Your Altcoin ChoiceZcash has been very prominent in this profile just because it keeps on coming up. This analysis is a request by one of our long-term followers. Let's dive into this chart.
ZECUSDT produced a bottom in March 2020 followed by a bull market, similar conditions we have in 2024/2025.
The 2021 bull market toped at 2,067% total growth, from bottom to top.
The present day situation looks much better. ZECUSDT bottomed in June 2024. Projected ATH in 2025 would reach a total of 3,627% total growth. From current price, growth can amount to 1,476%. This is based on standard bull market dynamics. An extraordinary bull market would send prices much higher. An extended super bull market would produce numbers that right now we cannot easily comprehend.
ZECUSDT produced a strong wave in late 2024. There was a flush in February 2025 and another flush this week ending in a strong higher low.
I like these flushes, I consider them good because once they are over, we know that the down move is also over. Like this week, it has a long lower wick and is trading green. If the week closes green, basically we have a bullish bias and bullish continuation confirmed. Which means a rise in prices comes next.
Seeing a strong higher low, this opens up a higher high. Minimum, first target, would be $151. Considering the bull market and the positive conditions Cryptocurrency is experiencing, we can definitely expect additional growth.
A very easy but strong target is $235, there is likely to be more.
ZECUSDT is set to reach a new All-Time High in 2025. Additional details can be found on the chart.
This will be a great cycle.
This is a great Altcoin.
Prepare for massive growth.
Prepare means planning. How will you take profits when the bull market is underway?
Will you rebuy? If yes, for how long?
Will you sell? If yes, how much and when?
What's your plan?
If the market drops and you intend to hold, for how long are you willing to wait?
Are you ready to wait 2 months, 1 months or 6 months?
Are you ready to wait long-term?
If the market start to rise and continues rising and you lose notion of the map and how far prices can go, what will you do? How will you take profits? How will you approach this situation?
What are you doing now?
Start buying like it is the end of the world.
We have only weeks left before the start of the next bull market bullish impulse.
Only weeks. It is better to be prepared.
Thank you for reading.
Your support is highly appreciated.
Namaste.

#ZEC/USDT#ZEC
The price is moving in a descending channel on the 1-hour frame and is expected to continue upward.
We have a trend to stabilize above the 100 moving average once again.
We have a downtrend on the RSI indicator that supports the upward move with a breakout.
We have a support area at the lower boundary of the channel at 37.40.
Entry price: 37.90
First target: 38.82
Second target: 40
Third target: 41

ZEC/USDT: Breakout in Play – 100%+ Upside Move Incoming?🚀 Hey Traders! ZCASH Breakout Alert – 100%+ Move Loading? 👀🔥
If you’re pumped for this setup, smash that 👍 and hit Follow for premium trade ideas that actually deliver! 💹🔥
🔥 ZEC/USDT – Massive Breakout in Play! 🚀
ZEC is breaking out from a symmetrical triangle on the 6H timeframe and has successfully retested it, confirming the breakout. 💥
With this solid retest, ZEC looks poised for a 100%+ upside move.
Long some here with low leverage and add more on dips to ride the wave higher. 🚀
💰 Trade Setup:
📍 Entry: CMP and add more up to $35
🎯 Targets: $41 / $52 / $63 / $72 📈
🛑 Stop-Loss: $32.80
⚡ Leverage: Use low lev (Max 5x)
🔎 Strategy:
✅ Enter with low leverage now
✅ Add more on dips and ride the breakout momentum 🚀
💬 What’s Your Take?
Are you bullish on ZEC’s breakout potential? Share your targets, analysis, and predictions in the comments! Let’s crush it and secure those gains together! 💰🔥🚀


#ZECUSDT #1D (Binance Futures) Descending channel breakoutZcash broke-out printing a morning star, looks good for recovery towards 100EMA resistance.
⚡️⚡️ #ZEC/USDT ⚡️⚡️
Exchanges: Binance Futures
Signal Type: Regular (Long)
Leverage: Isolated (2.0X)
Amount: 5.9%
Current Price:
36.12
Entry Zone:
36.05 - 33.55
Take-Profit Targets:
1) 41.83
1) 47.12
1) 52.42
Stop Targets:
1) 28.92
Published By: @Zblaba
SEED_DONKEYDAN_MARKET_CAP:ZEC BINANCE:ZECUSDT.P #1D #Zcash #Privacy z.cash
Risk/Reward= 1:1.2 | 1:2.1 | 1:3.0
Expected Profit= +40.4% | +70.8% | +101.3%
Possible Loss= -33.8%
Estimated Gaintime= 1-2 months

The key is whether it can rise to around 44.80
Hello, traders.
If you "Follow", you can always get new information quickly.
Please click "Boost" as well.
Have a nice day today.
-------------------------------------
(ZECUSDT 1M chart)
-
(1D chart)
Since the M-Signal indicators on the 1D, 1W, and 1M charts are converging, the key is whether it can rise to around 44.80-49.89 and maintain the price.
If it fails to rise, the support around 27.89-33.18 is important.
If the price continues to rise, the HA-High indicator on the 1M chart is formed at 115.72, so it is expected that a full-scale uptrend will begin only when it rises above this point.
If the HA-High indicator on the 1M chart is newly created according to the price movement, it is important to see whether there is support near that point.
Based on the current price position,
1st: 44.80-49.89
2nd: 70.62-48.91
I think that the 1st and 2nd areas above are likely to be resistance zones.
However, if it receives support in this area, it is likely to show a sharp rise.
-
Accordingly, I think that the time to buy is when the M-Signal indicator on the 1D, 1W, and 1M charts rises above this point and shows support.
-
Thank you for reading to the end.
I hope you have a successful transaction.
--------------------------------------------------
- Big picture
I used TradingView's INDEX chart to check the entire range of BTC.
(BTCUSD 12M chart)
Looking at the big picture, it seems to have been maintaining an upward trend following a pattern since 2015.
In other words, it is a pattern that maintains a 3-year upward trend and faces a 1-year downward trend.
Accordingly, the upward trend is expected to continue until 2025.
-
(LOG chart)
Looking at the LOG chart, you can see that the upward trend is decreasing.
Accordingly, the 46K-48K range is expected to be a very important support and resistance range from a long-term perspective.
Therefore, I expect that we will not see prices below 44K-48K in the future.
-
The Fibonacci ratio on the left is the Fibonacci ratio of the uptrend that started in 2015.
That is, the Fibonacci ratio of the first wave of the uptrend.
The Fibonacci ratio on the right is the Fibonacci ratio of the uptrend that started in 2019.
Therefore, this Fibonacci ratio is expected to be used until 2026.
-
No matter what anyone says, the chart has already been created and is already moving.
It is up to you how to view and respond to it.
Since there is no support or resistance point when the ATH is updated, the Fibonacci ratio can be appropriately utilized.
However, although the Fibonacci ratio is useful for chart analysis, it is ambiguous to use it as a support and resistance role.
The reason is that the user must directly select the important selection points required to create the Fibonacci.
Therefore, it can be useful for chart analysis because it is expressed differently depending on how the user specifies the selection point, but it can be seen as ambiguous for use in trading strategies.
1st: 44234.54
2nd: 61383.23
3rd: 89126.41
101875.70-106275.10 (when overshooting)
4th: 134018.28
151166.97-157451.83 (when overshooting)
5th: 178910.15
-----------------

Zcash Continues Bullish: The Bottom Is In, Higher Prices ForeverNotice how Zcash continues bullish and moving within a rising channel. For this pair also, 3-Feb. means the correction/market low. This is always quite revealing because the Cryptocurrency market is one; what one does, the rest follows.
ZECUSDT has been producing higher highs and higher lows since July 2024, more than 8 months now.
The flush earlier this months is confirmed a flush because of the long wick on the 3-Feb. session candle. The lower wick is very long as the market was activating all the stop-loss orders that are set on the exchanges. This is why I recommend using a manual stop-loss. If you used a manual stop-loss, this move would result in no loss and the market recovers the next day. If you set a limit order as your stop-loss, you are simply telling the exchanges and the bots that you are committed to sell at a low price, and that's exactly what you get.
It is better to buy and hold focusing on the long-term.
Cryptocurrency is new.
Cryptocurrency is bullish.
Cryptocurrency is young.
With a new, bullish and young market, the best strategy is to buy and hold.
Cryptocurrency is the Internet 2.0.
We are only getting started and we will definitely change the world; for the better.
Thanks a lot for your continued support.
Namaste.

Super Squeeze On Zcash Monthly I’ve believed a lot in zcash over the years. Held the top and did other things. Looking at the chart again Im thinking it’s time to buy some more. This project has always seemed like a long term company in my opinion and I’ve always looked at it like a real competitor to Bitcoin. The price has been very bearish overall but looking at the bigger timeframes things are looking to be at a reversal/resolution. I used to call it Zcash the stash and bought a bag at $65. Like I said I’m tripling down. Na. Quadrupling down. You get the vibe. Unless you’re blind, you see the squeeze.

Zcash Ready, Will Hit A New ATH In 2025!Zcash has been absolutely awesome lately and this chart tells us that the best is yet to come.
Between July and December 2024 there is present on the chart a ~400% bullish wave. This is great. But, if prices were at the high of this wave it would feel uncomfortable to enter this market, to buy-in.
Guess what? Good news!
The flush earlier this month erased all gains from the previous bullish wave. This means that a new buy opportunity is present. We have great entry prices available for long-term gains.
The long-term gains is the 2025 bull-market.
Now, look at the chart.
The early 2025 February flus produced a new All-Time Low. This is a buy opportunity.
The wick low reversed at the same level as back in July 2024. This same level of the 2020 March flush. After the 2020 March flush, ZECUSDT grew by an astonishing 2,100%.
This is what I mean. Now that the flush is over, we are approaching a major bullish wave.
Even if some major exchanges remove this pair, this will do nothing to Zcash other than some temporary crash. Maybe.
Cryptocurrency is unstoppable and set to forever now grow. Today, yesterday and tomorrow. Tomorrow now, forever more.
Based on candle close we have higher highs and higher lows. Notice the blue lines on the chart.
We are due a new All-Time High in 2025.
Total growth potential from bottom to top can vary between 2,500% and 6,000%. I know, it is a wide range but the market is unpredictable when it comes to the exact top numbers, what can be predicted easily, is the upcoming bullish wave.
The market will grow.
Do you agree?
If yes, make sure to follow.
If no, continue reading and soon your idea will be the same.
If you don't agree by next month, the numbers will change your mind.
This is not speculation, I am telling you the future now, before it happens.
Cryptocurrency will grow.
The Altcoins will grow.
Bitcoin is going up.
This market force is unstoppable.
We are going up. The new finance is going up.
Thanks a lot for your continued support.
Namaste.

#ZEC–Bullish Reversal in Play? | Harmonic Pattern and DivergenceDowntrend Reversal in Sight?
#ZEC has been in a consistent downtrend and is currently at its lowest point. But the charts are telling a different story now.
Key Technical Highlights:
Harmonic Pattern: A clear Bullish Bat pattern has formed on the 1-day timeframe, signaling potential for reversal.
Bullish Divergence: We’re seeing a subtle bullish divergence, adding weight to the case for a potential trend reversal.
Resistance Break: The key confirmation level lies at 45.85. A break above this level will be our primary signal to go long.
What Does This Mean?
The technical indicators are aligning for a potential upward shift, but patience is key. We’ll need to wait for the resistance to break before entering the trade.
Once confirmed, we’ll be looking for a bullish entry at 45.85 with careful risk management in place.
Join the Discussion!
What’s your take on #ZEC? Are you seeing the same potential reversal, or is it too early to call?
Have you traded harmonic patterns before? Share your experiences below!

ZEC Update (1W)For ZEC, we considered two diametric or triangle scenarios, and we had spot purchases on ZEC at much lower prices in VIP.
Considering the overall crypto market scenario, it makes sense to consider a large triangle for ZEC instead of a large diametric.
From the red range, the triangle formed by ZEC can end and ZEC will become bearish in the medium and long term.
Closing a weekly candle above the invalidation level will violate the analysis.
For risk management, please don't forget stop loss and capital management
Comment if you have any questions
Thank You

Told ya!BINANCE:ZECUSDT
it reached the second support I told you about!
⚠️ Disclaimer:
This is not financial advice. Always manage your risks and trade responsibly.
👉 Follow me for daily updates,
💬 Comment and like to share your thoughts,
📌 And check the link in my bio for even more resources!
Let’s navigate the markets together—join the journey today! 💹✨

#ZECUSDT #1h (ByBit) Falling broadening wedge breakoutZcash regained 50MA support and broke out bullish on hourly, looks good for short-term recovery towards 200MA resistance and more.
⚡️⚡️ #ZEC/USDT ⚡️⚡️
Exchanges: ByBit USDT
Signal Type: Regular (Long)
Leverage: Isolated (10.0X)
Amount: 4.8%
Current Price:
49.41
Entry Targets:
1) 48.62
Take-Profit Targets:
1) 52.63
Stop Targets:
1) 46.61
Published By: @Zblaba
$CRYPTO:ZEC BYBIT:ZECUSDT.P #Zcash #Privacy z.cash
Risk/Reward= 1:2.0
Expected Profit= +82.5%
Possible Loss= -41.3%
Estimated Gaintime= 2-3 days
