Idea on ZEC USDT perpetualZEC USDT perpetual continues with bullish reversal. You can take advantage of the short pull back to an area of confluence at above 61% golden pocket fib retracement.
Zec

Zcash will test your patience forever - Q3 2022 Moon?“Arguing that you don't care about the right to privacy because you have nothing to hide is no different than saying you don't care about free speech because you have nothing to say.”

Zcash - ZEC Waves for Zcash, prediction, already these waves started, so, just looking at the probability here, so far, we have been following so I wanted to post this chart. Anyway, it is clear that there was a bottom, and now we are moving on our way up nicely.
Not financial advice.

ZCASH Reach 170$Hello every one
ZCASH / TETHERUS
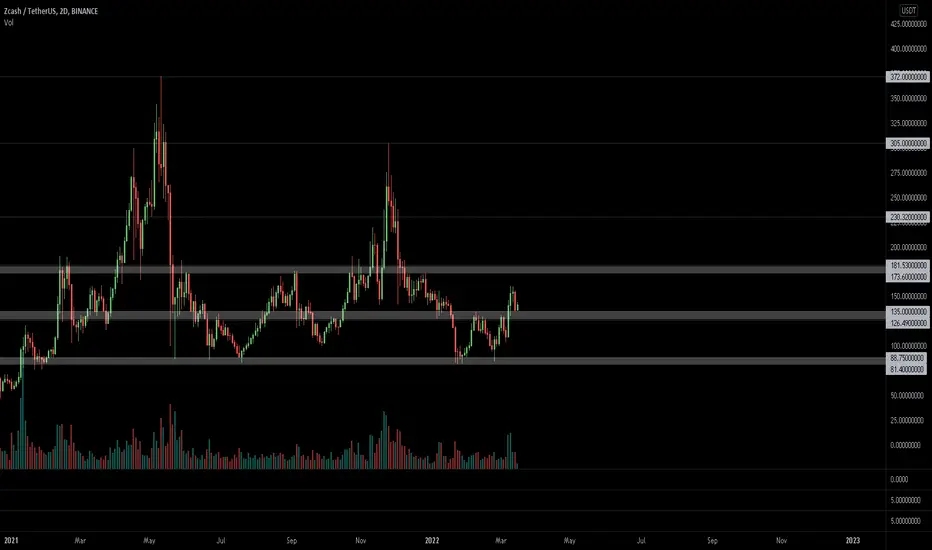
🟡Chart is speaking it self!
-ZCASH was in an Ascending Triangle
-The break out has Already Happened
-130$ can be considered a New Support
-If AB=CD than the Price Should be able to reach 170$
_ _ _ _ _ _ _ _ _ _ _ _ _ _ _ _ _ _ _ _ _ _ _ _ _ _ _ _ _ _ _ _ _
Thank you for seeing idea .
Have a nice day and Good luck

$ZEC Long-term Trend = PT Sub $100?Zcash continues to reflect bearish decline in spite of the wildly volatile price action.
Trendline indicates sub $100 PT remains valid, although $240 is within reach & flirting with $260 is not unrealistic.
Solid opportunities for momentum trading long & short positions.

ZEC Continues upward in wedge about to breakoutWatch ZEC continue to rise as the Russians use ZEC to bypass sanctions. ZECs anonymous transactions make it a preferred crypto currency for the Oligarchs looking to work around the sanctions (also Pirate Chain is the other). Over the next 18 days I see ZEC going up another 20+% and then it will cross over the upper resistance and continue upward to $300. UNLESS sanctions are lifted. If the sanctions are lifted get out of the privacy cryptos at least for a little while as the Oligarchs pull their money out as they won't need to use it any longer.

$ZEC, Trying to go for a flip over ~130$ area$ZEC
Trying to go for a flip over ~130$ area
UCTS bullish on the 1D & 2D timeframes (usually strong)
If gets traction from here then 180$ seems feasible
#ZEC
ZEC ready to dump! BE PREPAREDZEC has had one incredible run up to the T200 mark.
However, as I stated in a previous video today: ZEC poised to be trapped within it's descending triangle from over this past year. Zcash is in a historic downtrend right now.
-Note the RSI in purple at the bottom of the screen
-As I pull back to look at the daily ticker, you will notice that the strength index has progressively gotten more and more saturated throughout this hyper positive trend
-Any RSI that saturated and just... straight-up -wettt- is going to finally get overstimulated enough to want to tap-out.
New traders : MAKE SURE you take the time every once in a while to pull back on a daily or even weekly ticker and ident your positive or negative overall trends for a token.

🚨 ZEC Beware 🚨 @~T200 Quick video detailing the fact that ZEC will meet strong resistance once meeting the downward trend at some point in the coming months.
(ZEC will drop back to it's weekly pivot)
Make sure, before you start poppin' cherries on hot tokens you'd never charted/hadn't charted in a while, look back at the daily and make sure you're not going to get shanked at the historic down-trend.

#ZECAs I said, we are approaching the resistance line of $190. To continue the upward movement, we need to consolidate above the line.

XMR bursts through the resistance trend!! ~204 to ~208Discussing XMR breaking through the trend to hopefully give us another nice pump up to the first resistance pivot
also discussing ZEC at the end, and the fact that ZEC is on a historical downward trend.
EDIT 03/24/22 @1805hrs MDT just noticed in my little ZEC analysis that historically, ZEC is forming a nice little triangle breakout with my bottom trend line. I think I am going to follow this, chart it some more and see where it goes. Happy trading everyone! ALSO: NOTICE XMR's HISTORIC VOLUME.... 🛫☁☀️👆

Zcash Reversal Rally potential on Low Time FrameA purely peer-to-peer version of electronic cash would allow online
payments to be sent directly from one party to another without going through a
financial institution.
Digital signatures provide part of the solution, but the main
benefits are lost if a trusted third party is still required to prevent double-spending.
We propose a solution to the double-spending problem using a peer-to-peer network.
The network timestamps transactions by hashing them into an ongoing chain of
hash-based proof-of-work, forming a record that cannot be changed without redoing
the proof-of-work.
The longest chain not only serves as proof of the sequence of
events witnessed, but proof that it came from the largest pool of CPU power. As
long as a majority of CPU power is controlled by nodes that are not cooperating to
attack the network, they'll generate the longest chain and outpace attackers.
The network itself requires minimal structure. Messages are broadcast on a best effort
basis, and nodes can leave and rejoin the network at will, accepting the longest
proof-of-work chain as proof of what happened while they were gone.

Zcash vs Bitcoin must avoid the 1D Death Cross!Zcash is an implementation of the Decentralized Anonymous Payment scheme Zerocash, with security xes and improvements to performance and functionality.
It bridges the existing transparent payment scheme used by Bitcoin with a shielded payment scheme secured by zero-knowledge succinct non-interactive arguments of knowledge (zk-SNARKs).
It attempted to address the problem of mining centralization by use of the Equihash memory-hard proof-of-work algorithm.
the era of privacy is coming #FIRO $FIROFiro (FIRO), formerly known as Zcoin, is a cryptocurrency that focuses on being private digital cash. It created the Lelantus privacy protocol which allows users to burn their coins and redeem them later for brand new ones that do not have any transaction history.
FIRO WILL BECOME A PRIVACY COIN INFRASTRUCTURE!
My Target is 14$ for now, but i believe 39$ is easy to hit

ZEC ready to complete 3 pushesEverything clear on the chart, we are having a bearish channel in an uptrend which 75% of the time will make a bullish flag and continue with trend, on the other hand the bearish channel is looking like a falling wedge ready to break with a nice signal bar.
NFA

ZEC is in a wedge, but should break through the top resistanceIf you look at what PirateChain is doing after the sanctions were placed on Russia, you will see privacy crypto is in high demand. As the war drags on and the sanctions continue to strangle the Russian Oligarchs they will continue to use Privacy CryptoCoins to move money. ZEC has already had good upward movement after the sanctions were put in place. Even if they move toward the top resistance line that is a good return, but I believe it will break through that resistance if the sanctions are still in place. Just watch the news and get out if it looks like sanctions are going to be lifted. Yes I know this isn't the way to play the wedge, but with real world events I believe this is the time to get in and maximize profits.

Long Grayscale Zcash Investment Trust, soon to be a Zcash ETFThis is a no-brainer. my actual entries are $13.75 so this is a late push on trading view breakout

Zcash (ZEC) Long-Term Channel Drawn (101% Potential Profits)Notice the "blue channel" in which ZECBTC is moving...
There is potential for a challenge now of the upper trendline.
My classic signals (MACD, RSI, EMAs, etc.) are also present and bullish. Some early others confirmed.
We can aim at the upper channel trendline as target or the 0.786 Fib. extension level for the whole structure since January 2021.
I believe the chart to be self explanatory.
This isn't any type of advice.
Just sharing what I see on the chart.
:)
Namaste.

Bullish div & support ZEC weeklyWeekly:
Weekly bar closed high and gives us a bullish divergence, including a bounce off of support. Entry around 126 (wait for a pullback on a shorter timeframe).
A bottom has been formed and the weekly bar closed positively, showing a strong rejection of that support level and stochastic RSI came from an oversold condition, now curling up from this condition.
After the bullish divergence on the daily, see previous trade that worked out very well that downtrend seems to reverse
Entry: 126-128,5
SL: 102 (will move it up)
TP1: 177 (resistance)
TP2: 180 (1 ATR level, or higher, I'll let this remainder run probably with a trailing stop)
2022#003

ZEC/USD Main trend (part). Anonymous cryptocurrencyAnother anonymous cryptocurrency with at least some liquidity.
Main trend (part). Timeframe 1 week to understand what happens in the main trend.
After pumping and reaching the goal of $380 (marked earlier), the pullback and the formation of a harmonious butterfly pattern. At the moment the price is in the formation of its second part. The figures marked the potential entry points, depending on your trading strategy and the market situation that arises during the development of the trend in the future.
It is rational to enter the market on the breakdown or rollback after the breakdown of the descending line of the secondary trend, which is resistance of the second part of the harmonic figure. Another option is to dial in parts from the zones of support levels by martingale. When working with this method correctly distribute the volume of potential entry in advance, remember the main thing is the average price of the set, and not to buy off the "bottom".
At a reversal on the undersized amount you can on a breakdown or rollback after the breakdown of the downtrend (if the price has not taken off considerably) to get the position by the pyramiding method, but it is not obligatory.
In very hard times, for very "fat wallets" (not cryptocurrency) like most of anonymous cryptocurrencies, it is very likely that "pumping with stick" will take place in a moment... when there will be "saving money."
Previous closed trade idea for this cryptocurrency: From and to. 51-380
ZEC/USD Main Trend. Breakout. Butterfly. Downtrend triangle
ZEC/USD Local work. Downtrend triangle. Pivot zone

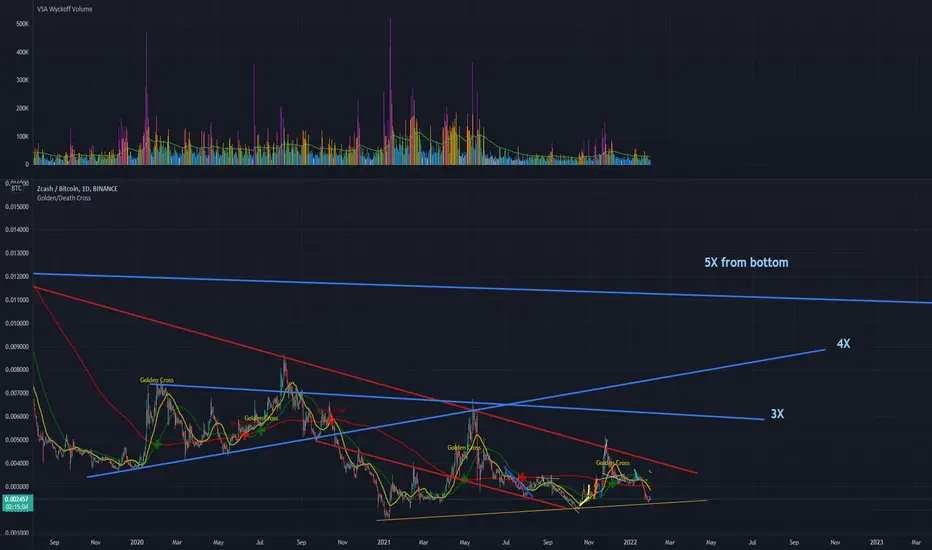
Binance Market - Zcash vs Bitcoin - double bottom reversalMaximum near term target is 10X from the local bottom which about 0.019000
the 5X target looks more reasonable 0.0110000
less ambitious targets also relevant. Primary drivers are the supply shock squeeze, and whether or not Robinhood App includes Zcash in its new set of crypto asset markets.
Its already got access to the #2 and #3 FOMO apps which are WeBull and Public.com

ZEC / USDTAs you can see in the chart ZEC was rejected by the resistance, keep eye on the chart and wait for the confirmation to make it short or long
Just follow the line that I draw
DO NOT FORGET TO USE STOP LOSS BEFORE ENTERING THE MARKET
This is not financial advice it's just my opinion sharing with you guys / Before entering the market DOUBLE CHECK IT and do trading based on your own strategy
I do trading based on Patterns and Zone by Zone / Find your own way that suits you

ZEC Bearish Zec looks bearish as it has approached some key resistance.
Id be looking at areas such as 171 to start taking profit from the short
