ZEC 8h market mapKey points:
- Change of behaviour (Higher highs and lows).
- Volume breakout.
- Price above median line.
- Started the uptrend before BTC and ETH.
Will ZEC outperform BTC & ETH?
Highly possible.
Good luck all.
Zec

ZEC Breakout Confirmation NeededZcash has realized a bullish reversal this week as the markets absorbed inflation reporting, the EU parliament excluded language restricting Proof-of-Work from MiCA, and the Federal Reserve clearly conveyed no substantive change to monetary policy in the immediate future.
Bullish price action likely to continue if ZEC confirms a breakout from the descending triangle with a daily close above the trendline, idealing realizing $170 support with a clean bounce.
Broader markets appear poised to enjoy bullish sentiment for next few months given midterm elections this fall.
Significant risk of further inflationary pressure resulting in a monetary policy reversal cannot be ignored.
Closely watch CPI & PPI in the coming months as these likely will see further sharp increases that will ultimately result in Central Banks reversing course.


ZEC is coming down to $150I see ZEC retracing from the recent over $178 down to $150 before any other rally may happen.

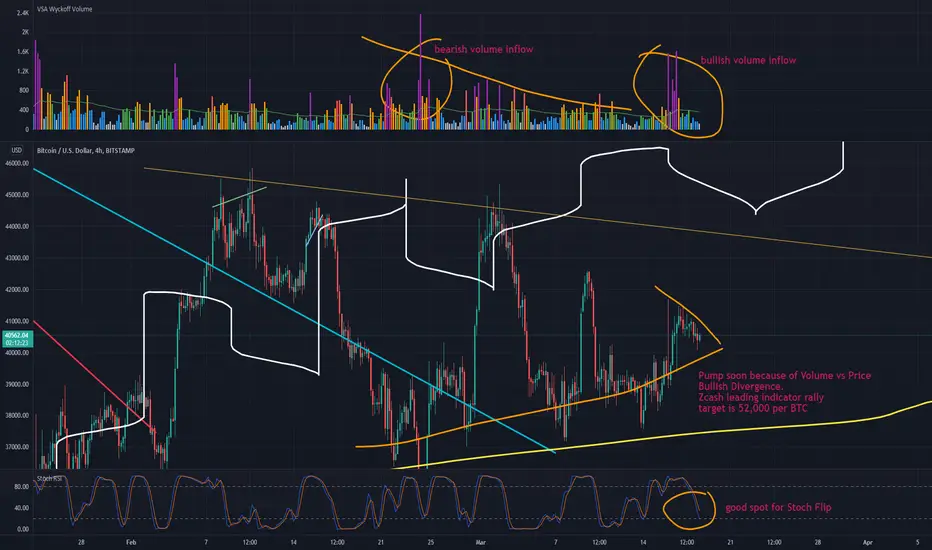
Bitcoin Pump Ready, strong close for March. Spring time Rally 🚀“Thy has resolved personal worth into exchange value,
and in place of the numberless indefeasible chartered freedoms,
has set up that single, unconscionable freedom—Free Trade.
In one word, for exploitation, veiled by religious and political illusions,
it has substituted naked, shameless, direct, brutal exploitation.”

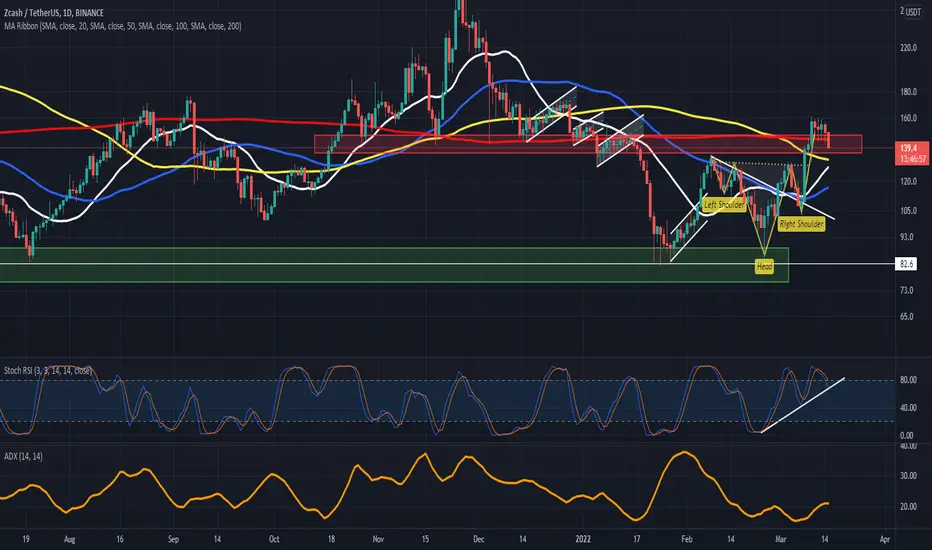
Zcash Reversal or Bearish Continuation ZEC will need to close daily above descending trendline and see more bullish support or risk retracing into the right shoulder of a very clean head & shoulders pattern on daily charts.
ZEC is volatile and sideways chop at current price is unlikely to continue... in the coming day or 2, it will either break up and reverse the long-term bearish trend, or fall back into the descending triangle.
Overall, Crypto faired very well so far this week, appearing to shrug of major headwinds:
1. EU MiCA did not adopt language against Proof-of-Work
2. Inflation measure Feb results by BLS show PPI up 20% year over year, zooming past Jan inflation #
3. Federal Reserve FOMC towed the line with 25 bps and a cautious Chairman continuing measured and dovish leaning communication while acknowledging inflation... pointing to healthy near full employment without diving into the real and severe labor shortage the US faces.
Markets responded to the sheepish FOMC action rallying up and apparently exuberant the Fed kicked the can down the road again.
Fundamentals of the economy remain unhealthy, equities and assets are sky high, inflation is roaring, the regulators are not looking to control anything until after the mid-term elections.
This complacency is likely to result in a harsher correction the longer the facade continues.


$ZEC Volatility Trend = Sub $90 TargetCharting from Daily to 3-Day charts reflect head & shoulders pattern forming with the left shoulder and head formed. Given price action trends with wild swings up and down, Zcash will either retrace fully to sub $90 or probable right should forms before final retracement.
Once retrace by >70%, historical $ZEC price realizes bullish reversals.
Continuing to see lower highs since 2018, to include May & Nov 2021.
$ZEC has volatile price movements... recently:
1. +116% late Nov 2021
2. -73% from local Nov 2021 high culminating on Jan 24, 2022
3. +89% Feb 24, through Mar 10, 2022
Further downside pressure is likely given the broader macro-environment with inflation spiking, bond yields climbing, and the Federal Reserve meeting on 3/16 with expected rate hikes followed by tightening monetary policy and scaling out of quantitative easing.

ZEC Sub $90 Limit Orders? ZCash large triangle May 2021 local high with breakout in August to reach lower high in Nov forming a smaller triangle.
Higher time frame shows massive double top with lower high in Nov 2021 than May 2021.
6 hour chart shows price action forming a head & shoulders pattern with Price target sub $90 before potentially recovering above $130.

Bulls receive a rejection from the $160 mark The Zcash coin has been slipping lower since beginning of this week and has lost almost 9.8% in just 3 days in price.
The market cap of the ZEC token is down 8.7% over the last night, which is now $1.9 billion.
Panic sellers are approaching the 200-day moving average on the daily price chart. If the bears manage to close today's price candle below the 200-MA, the remaining MA could act as a support level for the buyers.
Stoch RSI is retreating from the overbought area. The RSI is likely to bounce back from the bullish trend line (white). Furthermore, the Average Directional Index is indicating a weak bearish momentum for the ZEC coin.
Today the price of ZEC has slipped below the narrow horizontal range the coin was trading in for over 4 days. The 100-MA could act as a dominance zone for buyers for the upcoming trading sessions.
Resistance level- $190 and $300
Support level- $100 and $80
Zcash shortZcash broke trough the ascending trendline. Asset broke trough the support level. Bearish movement to support level at 113 is expected to happen.

Zcash shortZcash broke trough the ascending trendline. Asset broke trough the support level. Bearish movement to support level at 112.6 is expected to happen.

ZECUSDTHello Crypto Lovers,
Mars Signals team wishes you high profits.
We are in the daily time frame. The price broke its resistance line and after a small pullback, it moved up strongly to the next resistance zone. The price can move down to the confluence of two supports and it will range between these two areas.
Warning: This is just a suggestion and we do not guarantee profits. We advise you to analyze the chart before opening any positions.
Wish you luck

Potential Swing Bearish/Short ZEC UsdtTaking into account the current bearish nature of the market,most of the times those assets that tend to pump hugely without any logical reason except pump and dump scenarios, tend to crash the hardest as well.
I believe this asset is a strong candidate for this type of trading.
Key points:
Type of Trade : Short
Stop loss - 190 - 25% movement
Take profit - 90 - 40% movement
Capital used - 1% of the account for stop loss making a 1.6 profit factor trade in case of winning


#ZECUSDTClamped above the serious level of $125. This level has now become a strong support line. The next strong resistance line is $190.

ZECUSDTI want to see correction at this level followed by a strong breakout from it with volume to say that ZCash finished its bearish market and will start to record new highs
target is highlighted
zec long entry ZEC coin go long from this are its daily ema and fib line and also from 4H average signal but solid because from daily chart
keep it safe if you like zec coin and want hold this is good entry not for futures trading just my opinion
because market is crazy better for holding this coin

Short ZEC Potential bearish tradeToday we have another good opportunity risk reward short entry, for this bearish market.
In this case I am looking at some anomalies(big pumps without a reason inside a bear market) and short them when I believe they are close to top/ATH
Key points:
Type of entry : Short
Take profit level 1 : 135
Take profit level 2: 120
Stops loss : 170

low time-frame ZEC scalpalthogh price has been in a local uptrend , I notice a massive selling volume on BTC pair. if BTC doesnt go up unexpectedly we can expect a minor decline in ZECUSDT.
MAKE SURE YOU FOLLOW OUR CONTENT ON ALL PLATFORMS.

ZECUSDT - Resistance Breakout!ZECUSDT (1D Chart) Technical analysis
ZECUSDT (1D Chart) Currently trading at $140
Buy level: Above $137
Stop loss: Below $103
Target 1: $158
Target 2: $172
Target 3: $190
Target 4: $250
Max Leverage 2x / Spot Market
Always keep Stop loss
Follow Our Tradingview Account for More Technical Analysis Updates, | Like, Share and Comment Your thoughts

