Zcash (CRYPTO: ZEC) Gearing Up For A Mega-Move To New Heights!🤑Zcash is a digital currency, or cryptocurrency, like Bitcoin. (In fact, Zcash was built on the original Bitcoin code base.)
It was conceived by scientists at MIT, Johns Hopkins and other respected academic and scientific institutions.
You can use Zcash to buy goods and services — it's fast and confidential, great for payments — or you can exchange it for another kind of money, including US dollars, Euros or another fiat currency.
A major difference between most cryptocurrencies and traditional money is that every transaction is tracked and managed on a decentralized, public blockchain, instead of by a centralized institution, like a bank. This means you truly own your money.
Privacy within your control
Most cryptocurrencies expose your full transaction history and holdings to everyone, but shielded Zcash transactions are completely private.
Like Bitcoin, Zcash transaction data is posted to a public blockchain; but unlike Bitcoin, Zcash gives you the option of confidential transactions and financial privacy through shielded addresses. Zero-knowledge proofs allow transactions to be verified without revealing the sender, receiver or transaction amount. Selective disclosure features within Zcash allow a user to share some transaction details, for purposes of compliance or audit.
Zcash also allows for transparent transactions, which are completely interoperable with shielded addresses.
Efficient and usable
Use Zcash as a fast and reliable, inexpensive means to send money or digitally purchase goods and services. It is supported by top exchanges and wallets.
Audit- and regulation-friendly
Private addresses and transactions can be disclosed by Zcash users for information sharing, third-party audits or to comply with regulatory requirements.
Decentralized and attack-resistant
Zcash is decentralized and maintained by a wide network of people and machines, instead of a centralized entity, like a bank or government. There is no central database to be hacked and no single point of failure. There is no authority that can shut it down or prevent its use.
Private addresses & transactions
Privacy is built into the core of Zcash, allowing people to send and receive Zcash without disclosing the sender, receiver or the amount transacted. Privacy allows good people to transact safely over digital mediums. Transparent addresses and transactions are also available.
Zec

ZECHi,
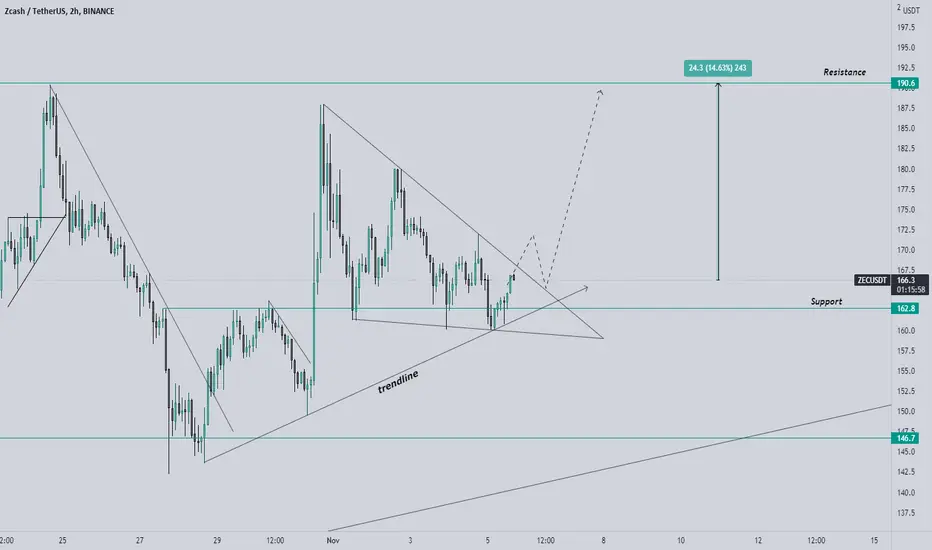
zec movement is little slow but moving upward. Last ATH was in month of May and after that significant move is pending.
the triangle has been formed and hoping to break soon.
the targets have been identified as per Feb retracement.
Expected long term ROI is very good.
This idea is for educational purpose only.
Please feel free to write in comments. Thank you.
Good Luck :)

ZEC going to push past 200 with ease and the bulls shall comeHop in, ZEC has been waiting like 5 years for a good pump. This is definitely a discount. not much to say ... besides we need zk lol bring on the roll ups and the gains.

ZECUSDTHello Crypto Lovers,
Mars Signals team wishes you high profits.
We are in a daily time frame.
The price is currently supported after the third encounter with its support line. If the price stays above our support line, we expect it to be able to reach the resistance line.
We have to wait and see if it can break the resistance line and stabilize, then buy to achieve higher targets.
Warning: This is just a suggestion and we do not guarantee profits. We advise you analyze the chart before opening any position.
Wish you luck

THE NEW BITCOIN (ZEC AND TAX HEAVEN)zec is an extraordianary technology, together with dash monero they are going to create a perfect ecosystem of tax evasion, they will create a privacy swap with a token that will represent the usd, it will be extraordian and perfect this triumbirate, if you do not buy what it cost that trump told you.

Number Go Up: Zcash ZEC vs Dollars less than 12 million token float.
recent partnership with
Ethereum - Market Cap 365 billion dollars
and Filecoin - 6.7 billion dollars
current Zcash market cap is 1.4 billion
which means to catch up with peers, it should at least gain 400% by end of year

💡Don't miss the great buy opportunity in ZECUSD @ElectricCoinCoTrading suggestion:
". There is a possibility of temporary retracement to the suggested support line (188.4).
. if so, traders can set orders based on Price Action and expect to reach short-term targets."
Technical analysis:
. ZECUSD is in a range bound, and the beginning of an uptrend is expected.
. The price is above the 21-Day WEMA, which acts as a dynamic support.
. The RSI is at 64.
Take Profits:
TP1= @ 219.6
TP2= @ 227.9
TP3= @ 248.5
TP4= @ 263.4
TP5= @ 292.1
SL= Break below S2
❤️ If you find this helpful and want more FREE forecasts in TradingView
. . . . . Please show your support back,
. . . . . . . . Hit the 👍 LIKE button,
. . . . . . . . . . Drop some feedback below in the comment!
❤️ Your support is very much 🙏 appreciated!❤️
💎 Want us to help you become a better Forex / Crypto trader?
Now, It's your turn!
Be sure to leave a comment; let us know how you see this opportunity and forecast.
Trade well, ❤️
ForecastCity English Support Team ❤️

💡Don't miss the great buy opportunity in ZECUSD @ElectricCoinCoTrading suggestion:
". There is a possibility of temporary retracement to the suggested support line (188.4).
. if so, traders can set orders based on Price Action and expect to reach short-term targets."
Technical analysis:
. ZECUSD is in a range bound, and the beginning of an uptrend is expected.
. The price is above the 21-Day WEMA, which acts as a dynamic support.
. The RSI is at 64.
Take Profits:
TP1= @ 219.6
TP2= @ 227.9
TP3= @ 248.5
TP4= @ 263.4
TP5= @ 292.1
SL= Break below S2
❤️ If you find this helpful and want more FREE forecasts in TradingView
. . . . . Please show your support back,
. . . . . . . . Hit the 👍 LIKE button,
. . . . . . . . . . Drop some feedback below in the comment!
❤️ Your support is very much 🙏 appreciated! ❤️
💎 Want us to help you become a better Forex / Crypto trader ?
Now, It's your turn !
Be sure to leave a comment; let us know how you see this opportunity and forecast.
Trade well, ❤️
ForecastCity English Support Team ❤️

ZCSHud think all that had private placement that wanted to sell would have sold $ZCSH by now.. with $ZEC punping/ at its highest since May i'm a buyer

#Zec / #Usdt #Spot
❇️Buy zone 1: 198~195
🎯Targets :
🎯#Scalp target : 208.6
🎯🎯#Shortterm targets : 227 / 260
🎯🎯🎯#Midterm targets : 310 / 341 / 372
🎯🎯🎯🎯#Longterm targets : 400 / 500 / 600
🛑Don't risk more than 3% of capital

ZEC - First Target $1300Hi this is my new update for ZEC. We have finally broke one of the biggest resistance $170-175 in the ZEC chart and the MACD is turning green and we are getting the bullish momentum again. I expect we are going to fill the gap between $195-225 easily, but a pullback to test the big support level $170-175 is normal. If we break the resistance $230, the next one is $260, but all of the resistances after $170-175 they are not so strong so we can easily break those. My first target for ZEC is $1300 and I have chosen this price target because, if we take the fibonacci from the 12th May that ZEC crashed to the bottom 21th July, we can get a full extension fib 4.236 around $1300 and there are many other coins that they have already reached that point so we can do this too (easy 600% gains). Today we saw good signs for the coins that are lagging behind (Dash up 10%, EOS up 7%, ZEC up 14%, BCH up 11%, LTC up 17%), all I want to say is that the coins that are lagging behind, they are going to have their bullrun (ALTSEASON). So be patient and don't PANIC ;)

ZECUSDT Major Resistance Breakout!!ZECUSDT (1D Chart) Technical analysis
ZECUSDT (1D Chart) Currently trading at $183
Buy level :Above $180
Stop loss: Below $140
TP1: $215
TP2: $250
TP3: $305
TP4: $375
Max Leverage 2x
Always keep Stop loss
Follow Our Tradingview Account for More Technical Analysis Updates, | Like, Share and Comment Your thoughts.

Strong support ( ZEC 1W )(( please read the description ))
Strong support, ZEC support by MA 50, The first Target is to defeat the resistance, Profit can also be in resistance.
tip :
* MACD ( Shows an uptrend )
* The trading is above the MA 50 (Blue line), one should hope for an uptrend and test the resistance Zone
I tried to identify the points of support and resistance for you, Trade smartly, Good luck.
.....................................................................
* In trading, the winner is the one who manages his profit and loss *
* The responsibility for buying and selling lies solely with you *
.....................................................................
********************************* pay attention ****************************
For stress-free trading, see BTC price trend, BTC is effective in all trades
****************************************************************************
~~~~~~~~~~~~~~~~~~~~~~~~~~~~~~~~~~~~~~~~~~~~
Please like, subscribe and share your ideas.
~~~~~~~~~~~~~~~~~~~~~~~~~~~~~~~~~~~~~~~~~~~~

🔥ZEC is a long exit from the triangle# ZEC / USD
🔥ZEC is a long exit from the triangle, pay attention to the trend that worked well.
ZEC Getting Ready For A Big PUMP 🚀ZEC is looking pretty good, as soon as we break the massive resistance that we have above there will be a very big parabolic movement on this cryptocurrency.
The more times a resistance is tested, the more chances there are of breaking it. This is what happens when you have a parabolic run, a massive crush, consolidate and then you are ready for more price action to the upside.
The first target after breaking this resistance and closing the day above it would be around 270.
We just need some green volume!


Towards $300-$400Its setting up for a big rally towards 300-400 range. If you are not in CRYPTO you are missing big. Get in and enjoy the ride while it lasts.

ZEC in my Bucket ZEC going well after the second touch to the triangle. I think well see good moves from it.

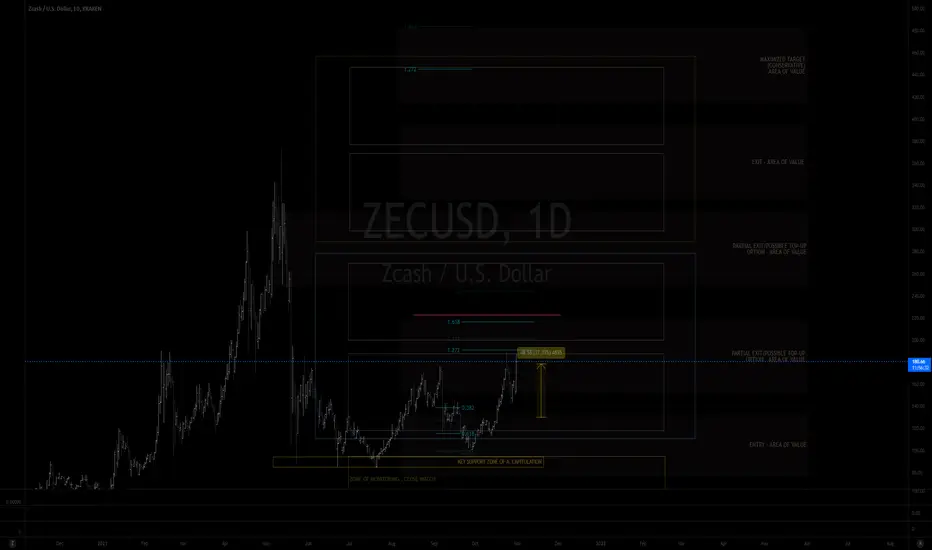
MY MINIMALIST ANALYSIS FOR ZCASH$ZEC
10.30.21
2001H +8 SINGAPORE
THROWBACK THURSDAYS
ALERT: ENTRIES, PARTIAL EXITS, EXITS, and MAXIMIZED AREAS OF VALUE
THIS IS AN AREA OF OPPORTUNITY: ZONE FOR AN ENTRY ( PRICE ACTION OF ETHEREUM & BTC GREATLY AFFECTS THIS MARKET)
As the 2 superpowers will accumulate after breaking ATH, we can see ZEC RISE. Just prepare!
Wishing you all The Best Trades and Thank you all for your Appreciation and Support of My Work.
Much thanks to My 3 Mentors!
Disclaimer:
The findings of the following analysis are the sole opinions of the publisher of this idea and should not be taken as a piece of investment advice.
"FOLLOW THE WHITE RABBIT!"
HOW TO USE THIS MINIMALIST CHART
Created on a MONTHLY, WEEKLY & DAILY Analysis (The Dynamics of the Market.)
It is designed for SWING TRADES at the BOTTOM. I do not SHORT, though, you can still use it.
TARGET ZONES IDENTIFICATION
The LARGE BOXES (Tops and Bottoms) are MAJOR pivot points that will occur sometime in the future. While the SMALL BOXES (Tops and Bottoms) are MINOR pivot points.
These can be entries to a BUY/ SELL POSITION, EXIT/PARTIAL EXIT/TOP-UP AREAS
and if you wish to hold longer for a MAXIMUM TARGET EXIT AREA OF VALUE -CONSERVATIVE (If price action conditions are right.)
At times I include WAY BEYOND PARABOLIC Price TARGETS depending on The Character of the Market.
Watch out for your Volume, Chart Patterns, Candlestick Math, Price Action, Fibs, Market Dynamics, and especially trading psychology.
Vive Le Austist!
Note: This CHART is best used without indicators.
Master your Trading Discipline
and Trader's Psychology
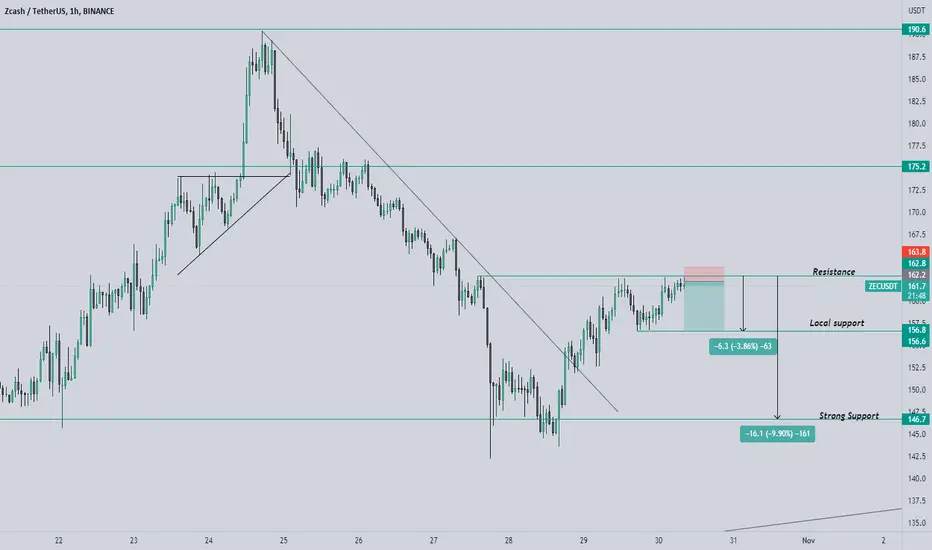
🔥ZEC is a short short with a short stop from the resistance zon#ZEC/USD
🔥ZEC is a short short with a short stop from the resistance zone.
$ZEC Looking extremely deliciousZECUSDT is looking extremely delicious on the daily chart, resistance has been tested and time to hit some green target lines


ZCASH PRO ANALYSIS...!Hello everybody...
This is my own analysis of Zcash. The targets are identified based on the RSI over-bought summits. So, be careful and don't forget to save your profit...
-Thanks-
