Zec

ZECBTC Update: Profit=8750 SL=1990 Reward/Risk > 4.4:1 Trade Setup summary:
Profit targets=8750 pip (750 + 1250 + 1750 + 2050 + 2950)
Stop Loss =1990 pip
Reward/Risk > 4.4 : 1
Current Status:
Total Profit: 1924 pip
Closed trade(s): 1924 pip Profit
Open trade(s): 0 pip Profit
Trade Setup:
We opened 4 BUY trade(s) @ 0.005494 based on 'previous Forecast' at 2020.06.21 :
Closed Profit:
TP1 @ 0.005600 touched at 06.23.2020 with 106 Profit.
TP2 @ 0.005800 touched at 06.23.2020 with 306 Profit.
TP3 @ 0.006100 touched at 06.24.2020 with 606 Profit.
TP4 @ 0.006400 touched at 06.24.2020 with 906 Profit.
106 + 306 + 606 + 906 = 1924
Technical analysis:
. ZECBTC is in a range bound and the beginning of uptrend is expected.
. The price is above the 21-Day WEMA which acts as a dynamic support.
. The RSI is at 60.
New Trading suggestion:
. There is still a possibility of temporary retracement to suggested support lines again. if so, traders can set orders based on Price Action and expect to reach short-term targets.
New Take Profits:
TP1= @ 0.008000
TP2= @ 0.008500
TP3= @ 0.009000
TP4= @ 0.009300
TP5= @ 0.010200
SL= Break below 0.006852
❤️ If you find this helpful and want more FREE forecasts in TradingView
. . . . . Please show your support back,
. . . . . . . . Hit the 👍 LIKE button,
. . . . . . . . . . . Drop some feedback below in the comment!
❤️ Your Support is very much 🙏 appreciated!❤️
💎 Want us to help you become a better Forex trader?
Now, It's your turn!
Be sure to leave a comment let us know how do you see this opportunity and forecast.
Trade well, ❤️
ForecastCity English Support Team ❤️

ZECBTC Update: Profit=8750 SL=1990 Reward/Risk > 4.4:1 Trade Setup summary:
Profit targets=8750 pip (750 + 1250 + 1750 + 2050 + 2950)
Stop Loss =1990 pip
Reward/Risk > 4.4 : 1
Current Status:
Total Profit: 1924 pip
Closed trade(s): 1924 pip Profit
Open trade(s): 0 pip Profit
Trade Setup:
We opened 4 BUY trade(s) @ 0.005494 based on 'previous Forecast' at 2020.06.21 :
Closed Profit:
TP1 @ 0.005600 touched at 06.23.2020 with 106 Profit.
TP2 @ 0.005800 touched at 06.23.2020 with 306 Profit.
TP3 @ 0.006100 touched at 06.24.2020 with 606 Profit.
TP4 @ 0.006400 touched at 06.24.2020 with 906 Profit.
106 + 306 + 606 + 906 = 1924
Technical analysis:
. ZECBTC is in a range bound and the beginning of uptrend is expected.
. The price is above the 21-Day WEMA which acts as a dynamic support.
. The RSI is at 60.
New Trading suggestion:
. There is still a possibility of temporary retracement to suggested support line (0.007250) again. if so, traders can set orders based on Price Action and expect to reach short-term targets.
New Take Profits:
TP1= @ 0.008000
TP2= @ 0.008500
TP3= @ 0.009000
TP4= @ 0.009300
TP5= @ 0.010200
SL= Break below 0.006852
❤️ If you find this helpful and want more FREE forecasts in TradingView
. . . . . Please show your support back,
. . . . . . . . Hit the 👍 LIKE button,
. . . . . . . . . . . Drop some feedback below in the comment!
❤️ Your Support is very much 🙏 appreciated!❤️
💎 Want us to help you become a better Forex trader?
Now, It's your turn!
Be sure to leave a comment let us know how do you see this opportunity and forecast.
Trade well, ❤️
ForecastCity English Support Team ❤️

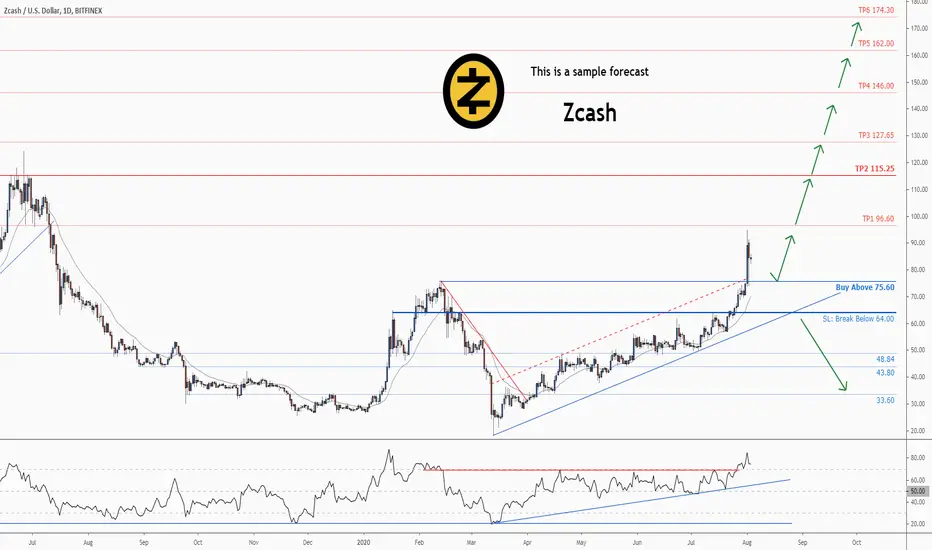
ZECUSD Update: Profit=124950 SL=11600 Reward/Risk > 10.7:1 Trade Setup summary:
Profit targets=124950 pip (2100 + 3965 + 5205 + 7040 + 8640 +9870 + 14980 + 19540 + 23670 + 29940)
Stop Loss =11600 pip
Reward/Risk > 10.7 : 1
Current Status:
Total Profit: 7732 pip
Closed trade(s): 4192 pip Profit
Open trade(s): 3540 pip Profit
Trade Setup:
We opened 3 BUY trade(s) @ 48.84 based on 'previous Forecast' at 2020.06.12 :
Closed Profit:
TP1 @ 64.00 touched at 2020.07.22 with 1516 pip Profit.
TP2 @ 75.60 touched at 2020.08.01 with 2676 pip Profit.
1516 + 2676 = 4192
Open Profit:
Profit for one trade is 84.24(current price) - 48.84(open price) = 3540 pip
1 trade(s) still open, therefore total profit for open trade(s) is 3540 x 1 = 3540 pip
Technical analysis:
. ZECUSD is in a range bound and the beginning of uptrend is expected.
. The price is above the 21-Day WEMA which acts as a dynamic support.
. The RSI is at 73.
New Trading suggestion:
. There is still a possibility of temporary retracement to suggested support line (75.60) again. if so, traders can set orders based on Price Action and expect to reach short-term targets.
New Take Profits:
TP1= @ 96.60
TP2= @ 115.25
TP3= @ 127.65
TP4= @ 146.00
TP5= @ 162.00
TP6= @ 174.30
TP7= @ 225.40
TP8= @ 271.00
TP9= @ 312.30
TP10= @ 375.00
SL= Break below 64.00
❤️ If you find this helpful and want more FREE forecasts in TradingView
. . . . . Please show your support back,
. . . . . . . . Hit the 👍 LIKE button,
. . . . . . . . . . . Drop some feedback below in the comment!
❤️ Your Support is very much 🙏 appreciated!❤️
💎 Want us to help you become a better Forex trader?
Now, It's your turn!
Be sure to leave a comment let us know how do you see this opportunity and forecast.
Trade well, ❤️
ForecastCity English Support Team ❤️

$ZCASH : Possible bottom setupZCash looks to be forming what is a ascending triangle, we are either going to break out upwards soon; looking at a S/R flip
Or retracement and see if we hold the diagnol support line to continue the pattern.

ZEC could pop up if resistance is brokenZEC pushing on the resistance line. Since I haven't been in this trade I'm waiting for it to hold this resistance before I get in as this could turn around and fall back. Looking pretty good with all of the supports being tested up. However, it could lead to an elevator fall back down.

$ZEC / #USD, Clear flip on the ~63$ level and pushing up...$ZEC / #USD
Clear flip on the ~63$ level and pushing up...
Looking for ~77$ as potential resistance level if all goes good around #BTC
#ZEC

ZCash (ZEC) to $140 by the end of August 2020See the fractal came from the red box ... my next sell target is $140 in around 25 days or less?
What do you think?

ZECUSDT AnalysisPeople who listened EngineeringRobo's MOON signal and bought ZEC, enjoy your 126.61% PROFIT that you made just in 3 months!
There's also MA20-MA50 cross strategy, super buy & green cloud follows right after moon signal.
I'm bullish right now since there are 4 buy signals from EngineeringRobo. If you are holding ZEC, do not hurry to sell as long as it's above the local support level. ($73.98)
Also, if you want to buy ZEC, you can buy right now but watch out for EngineeringRobo's SELL signals. The candles are at the local support level ($73.98). If there will be a sell signal, you can go ahead and sell it.

ZECUSDT ANALYSİSI have 4 positive signals.
If you bought this coin in March and you sold it when it broke the up trend line you have got x2 profit that is really good
other case , you bought in March and you are still holding you have got x3 profit that is wonderful
This coin's chart view is amazing you can buy( I mean join) at $ 58-59 level and wait for EngineeringRobo's sell signal
If you want to use EngineeringRobo please dm me.


ZECUSDT analysisThis is a strong buy with buy, moon and green robo cloud signal. We can sell at resistance.


ZEC ZCASH Bullish on Daily Chart - ZECUSD ZECUSDT ZECBTCZEC ZCASH Bullish on Daily Chart - ZECUSD ZECUSDT ZECBTC

ZECBTC Ascending TriangleStaying in the Zcash realm, ZEC/BTC Pair looks to form an Ascending Triangle as well.
Can see it pullback to the support one more time before taking off. Also good fundamentals with the halving coming up in November.
Could give extra fuel for a possible bulltrend.
Close below 6300 would invalidate the setup and possible bulltrend, at least for the short term
Trade safe :)


ZEC USD LONGTERM VIEW BULLISHZEC Bullrun Triggered
LONGTERM $500 000 ATH TARGET WILL BE IN GAME
ENJOY!

ZEC/USDT - Long - Potential 20%+Look after your portfolio and it will look after you & If you liked this idea, please like and subscribe to my profile
PAIR: ZEC/USDT
T/F: 1 HOUR
LENGTH: Medium
RISK - Low
ENTRY: 62.59
TP1: 64.39
TP2: 68.89
TP3: 72.79
TP4: 75.11
BONUS TP: 125.43 (100%
SL: 56.66
NOTES:
- Uptrend
- Sat/In on Support Zone
- Support Rejection Candles
- Breakout to Pullback
- Resistance>Support Flip
- News based rumours (Halving & Heartwood Network Upgrade)
KEY:
BONUS TP - It could continue to rise to a significant high although it is either very long term or a high rist target. REcommended to follow by securing profits with trailing stop loss.
LENGTH:
SHORT = 1-2 DAYS
MEDIUM = Less than 1 week
LONG = Less than 1 month
RISK:
LOW = E.G Stong support // Multiple bounces // Strong uptrend // Oversold // Breakout > Pullback > Support // Rejection Candles
MEDIUM = E.G Broken support // Trend Reversal // Consolidation
HIGH = E.G Not fully brokend Support // Overly mature uptrend
***Please note that all of my suggested Entries, TP's and SL's always ignore any precursor 0's***
Please always trade with caution, manage your trades and stop-losses This is not professional financial advice, just my thoughts and trades I am

ZECUSDT ANALYSISIf you have Zcash, enjoy the ride.
If you do not have and planning to buy, you should buy it now because the last candle passed the line(62) so now that line is a support line.

Perfect bearish butterfly #ZECBINANCE:ZECBTC ZEC/BTC making a bearish butterfly with weekly resistance

ZEC/BTC ZCASH Bullish Breakout.... 20% + Gains PossibleAs we can see, Zcash is currently challenging longer term triangle resistance on the 2 day / weekly chart. I would wait for a confirmation weekly close above this current resistance for entry.
However, there are multiple good signs here. 10/21 EMA's have flipped, daily stochs have bottomed and now crossing upwards, and bitcoin as well as the entire alt market is making a run. All indicators look good.
Potential profit targets (bright green) and bottom targets (red) are marked.
As always, set stop losses and trade responsibly. BTC and alts are erratic and can wipe out a position in an instant.
This is not financial advice.
