Zec

ZEC/BTC 500%-1000% within one Year According to my Analysis#ZECBTC 2020 Best TA update:
According to me ZECBTC is best coin for 2020.
#ZEC I am waiting for best opportunity for my entry zone.
best entry for me 0.003-0.004 BTC.
If my entry will hit then this will Best Buy zone.
so I placing bid.
I will accumulate more ZECBTC if more dip will come.
Support: 0.0036-0.00400BTC.
Targets : 5x-10x within 1 year.
Not financial Advice
#DYOR
Please like and follow me for latest crypto updates.
Thank you for your appreciation.

Support and Resistance Trade Setup [Quick Updates]Hey all, here’s another entry on my tradingview series called 'Quick Updates'.
In the chart you can find a nice and clean trade set-up based on support and resistance
--- What is The Quick Update Series All About? ---
I have started a new tag (quickupdates) where I quickly share great opportunities based on TA for shorter timeframes, such as 4h, 1h, and 15m. It will contain a brief explanation with clear and clean charts in order to keep the velocity up and make sure you get to see the opportunities as fast as possible.
If you want to learn more about how to place your limit orders including entry, stop-loss and take-profit, check out:
Follow me for consistent high quality updates, with clear explanations and charts.
Please like this post to support me.
- Trading Guru
--------------------------------------------------------------
Disclaimer!
This post does not provide financial advice. It is for educational purposes only!

Is Zcash Setting Up The Play?Symbol: ZECBTC
Clear long downward run it has been. But, we have broke out or Resistance and now are seeing the pullback to old Resistance. This could be a new support swing to the upside. No confirmation on my tools yet but I am just using tech. Analysis. Zcash really needs to create a higher high. Will stay updated on this one. Low cap coin / Privacy opt in coin
----------------------------------------------------
Want to level up your trading skills?
We just realesed our new course! Follow our tradingview page and visit the link in our bio if you are looking for new strategy to add to your arsenal.
Also checkout our trading indicator available in the link on our page.
---------------------------------------------------
Thank you for your continued support, God bless.
- Major League Trader

Last Call Aboard The Zcash ExpressPack your bags. Kansas is going BYE BYE
So long $33. Nice knowin ya

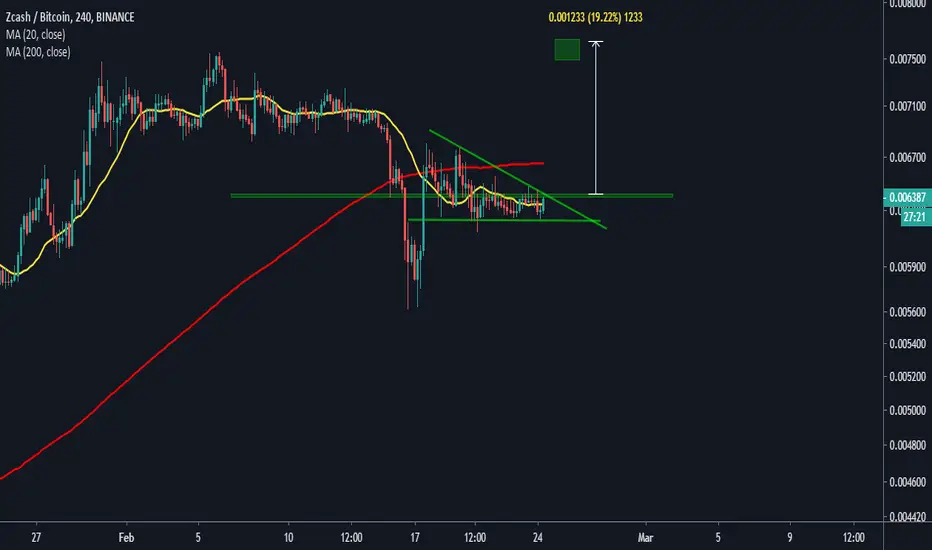
ZECDescending triangle into support.
Break the descending triangle upwards and retest it succesfully or further consolidation above support would have me buying.


ZCash (ZECUSDT) short.All description on the chart.
Please, don't forget to like and follow.
Thank you.

Beautiful LONG Opportunity Based on Support [QUICK UPDATES]Hey all, the Trading Guru is back with another entry on a new series called 'Quick Updates'.
Just found this support zone for ZEC that already got confirmed with a small bullish candle on the 5m, leading to a nice scalp opportunity. See the chart for information on stop loss, take profit, and entry positions.
--- What is The Quick Update Series All About? ---
I am starting a new tag (quickupdates) where I quickly share great opportunities based on TA for shorter timeframes, such as 4h, 1h, and 15m. It will not contain just a short explanation, in order to keep the velocity up and make sure you get to see the opportunities as fast as possible.
Follow me for consistent high quality updates, with clear explanations and charts.
Please like this post to support me.
- Trading Guru
--------------------------------------------------------------
Disclaimer!
This post does not provide financial advice. It is for educational purposes only!
About the links below:
20% Discount on Binance: Did you know that Binance introduced a new system where you can get 20% discount on your fees? Find the step-by-step guide on how to add it to your account on the website of 100eyes
Forex & Crypto Scanner: Nobody can keep track of all the pairs on all timeframes. This scanner works on Telegram and sends an automated message including a chart every time something happens to a coin. E.g. it can automatically detect areas of support and resistance, RSI Divergences, Fib Retracements, and more.

Zcash: $500 By ChristmasCurrent downtrend shows Zcash hitting $0 by EOY 2020
Such an occurrence is out of the question
Prepare for a breakout sooner than later as smart money seeks out alternative wealth storage vehicles in light of the Federal Reserve's plan, as revealed this morning, to initiate an unlimited asset purchase program

BTC Reversal Or Death!COINBASE:BTCUSD
BTC Scared the hell out of all of us last week but it looks like sunshine could be on the horizon.
Development of a rising triangle during recovery
4H volume looks like its dropping towards something large
1H volume looks like we have one more "Shoulder of an incomplete Inverse H/S pattern" dip until this larger 4H move
3 Consecutive higher Lows with RSI trending higher in tandem
A peak at the ZECUSD chart shows a quick move towards its 4H 50MA with a initial denial but still recovers higher then where we are now with the other alts and majors
Zcash could be an interesting leader during times like this as LTC and ETH have done in the past.
If BTC breaks the orange line and confirms a 4H + candle above the green, I'd say we are quickly returning to 8k in a hurry...


ZEC/USD LONG SET UPBUY ZEC/USD
ENTRY 1 36.86
Entry 2 30.46
SL 23.46
Tp.1 42.86
Tp.2 46.46
Tp.3 52.86
Tp.4 62.46
tp.5 76


ZEC - Zcash - STRONG BUYZECUSD : STRONG BUY
Analysis Method: Fibonacci & Wave Theory
About Zcash: z.cash
Launched in 2016 by Zooko Wilcox-O’Hearn and based on the Zerocoin protocol, Zcash (ZEC) is a decentralized and open-source privacy-focused cryptocurrency that enables selective transparency of transactions. Zcash transactions can either be transparent or shielded through a zero-knowledge proof called zk-SNARKs. This allows the network to maintain a secure ledger of balances without disclosing the parties or amounts involved. Instead of publishing spend-authority and transaction values, the transaction metadata is encrypted and zk-SNARKs are used to prove that nobody is being dishonest. coinmarketcap.com
Monthly: High/Low
Daily: Fib-Time/Minor Wave 1 & 2
6 Hour: Minor Wave 1 & 2
-Waves %: Extended 3rd
Minor Wave 1: 151%
45 Minute Chart: Micro-Wave
Immediate Target Area: $53-$57
Timeframe: 6 Days
Target Area: $85-$110
TimeFrame: 60 Days
Will update.
-FMW

Z CashI closed my Ethereum Classic trade at $8.39 yesterday. I told you in last post to stay out below $8.40, currently sitting at $8.10
Now what do I have my eyes set on.
I'm going to be watching zcash play out in this wedge.
We could see it breakout and form a right shoulder for about 35% gain.
Now I am scouting for my entry.
Almost the same pattern that ethereum classic broke from.

ZEC / Zcash Bullish divergence and retest - pullback to On the ZEC daily, we’re seeing a bounce on support, although we’re in a downtrend, I expect a pullback to the EMA.
Impulse on the daily is flipflopping between yellow and red, and allows me to trade.
This means that the EMA and/or the MACD Histogram are about to turn up.
We also see some long wicks on the bottom, that seems to show that further going down is rejected.
RSI is crossing up from a totally oversold condition.
On the 4 hour chart, I have a bullish divergence and a retest of this low after that, and then it seems to turn up and going up. That lower retest was also diverging with prices on MACD-H and Elder Force Index.
The stoploss can be placed in the lower wicks we’ve seen before at 49,1. I figure if we after the retesting of the low again again will come down, we probably are going down. Especially with the current bearish background of BTC.
For that same reason, I will tighten the stoploss as soon as I see a new higher low forming on the 4H timeframe, because of these market conditions.
Entry: 51.x
Target: 57.5 to 60.70
Stoploss: 49,1
R/R ratio: 1:3,5 to 1:4,6


ZEC: The BUY Opportunity** Not Financial Advise **
** Personal Opinion **
** Good Luck Have Fun Make Money **
ZCASH 2x in 2 months. Let's GO!
ZEC

ZEC/BTC analyses Hello Traders,
In the long term chart, we can see that the price just broke the long term Resistance line, and starts to acumulate above the Resistance witch a good sign for the bulls.
On the daily chart we can see that this acumulation is Bullish Retangule, and the price just touche the support of the and the bulls shows up, and we have a buying pressure on this area, and we are forming a Hammer Candlestick pattern, witch is sign for trend reversal
On intraday timeframes we have this short term Resistance above 0.0060 sats
If the price breaks this resistance we have a lot of possibility to test the top of the retangule
Please, push like button and follow us to receive more recommendations like that.

ZEC loooks like this one take a spike......zec will take a spike i think it will brek this tringle and go to moon..... invest

ZEC Double Bottom Playing Out Well In Daily RSI Quick update from previous post. Chart pattern is coming together nicely. Weekly RSI could potentially reverse off bottom of overbought territory while the Daily RSI makes its next impulse. 100 day MA just crossed 200 day MA with 50 day MA turning vertical way above the two. Small amount of Bullish Divergence printed in last three days, lower price but rising volume. On the weekly we are testing the 50 day MA as support. To me the chart is saying that we are fueling up for our next move UP. However, I could ways be wrong. Will update as trend progresses.
Please Like & Comment ------> Lets Be Friends **even if we disagree**
HAVE A GREAT DAY. LIFE IS A GIFT.
Not Financial Advice.
