Zcash aiming $125 by early DecemberContext: ~31 days until Zcash's first halving
Since April 12th we've entered an ascending channel with consistent higher lows and higher highs. We've yet to revisit this year's $100 high set during early August, but instead, have seen action mainly concentrated between the $50-$75 range. There seems to be strong support at $50, but even stronger at $44.
Possible Short-Term Scenario: We can touch the established bottom trendline of the ascending channel (around $55) followed by a bounce towards the $125 range in about a month's time.
Possible Long-Term Scenario: Extremely bullish with Zcash. We revisit January 2018's ATH by the next year 2021. Zcash has the potential to peak out at $3,737 during the final phase of this upcoming bull run, maybe January 2022 or January 2023.
ZECUSD

I'd be damned if I'd forget ZCash. ZECUSDIndeed! This one in particular brought me quite a few returns. Bullish, bullish, bullish. But too early to pose Fib targets.

ZECBTC - This is bottom of the ascending channelIt seems that we will see a price increase soon..
SL is confirmed closure below channel.

ZCash looks done or close to done 💥Looks like we are done or close to done for most pairs.
Possibly one more push on some pairs like zcash

ZCASH on 🔥Huobi 🔥 Fire Cannon UP!Z Cash is pumping with all the privacy coins and will have a halving event in the next couple of months. I recommended to buy here and then sell before resistance at around 80.
RSI is looking bullish and xmr is also along with many other privacy coins going up.
Load your bag this one looks good

ZEC Adam and Eve double bottomand currently forming the handle, of a cup and handle pattern. Target if breakout at $85

ZECUSD is getting bounced from the strongest support lineHey, friends hope you are well and welcome the new update on Zcash (ZEC) coin.
By the grace of Allah the most high my previous idea has been executed exactly as per defined targets:
Now on the weekly chart the priceline is having very nice bounce from 25 and 100 simple moving averages moreover the 25 SMA also has formed bull cross with 100 simple moving average. The 200 SMA is at $135 that can work as strong resistance as well.
On daily chart the priceline is moving in down channel since 1st Aug 2020. Now finally the priceline is closed above exponential moving averages with the time period of 10 and 21. The EMA 10 and 21 also have formed bull cross that can lead the priceline of Zcash to breakout the resistance of this down channel as well.
Volume profile of complete channel showing no interest of traders below $51 and very less interest above $80. Therefore a movement upto $80 is confirmed and there will be less chances to break down the support.
As we have seen earlier that the priceline of ZEC is getting bounced from the 25 and 100 SMAs on the weekly chart and also closed above the EMAs 10 and 21 on daily chart and likely to break out the resistance of the down channel as well. In the meanwhile, it has also formed the most significant bullish move and that move is the price action has reached the support. And this is the most strongest support since Nov 2019. We can observe that after reaching at this support the priceline 1st rallied 186% then 209%. At this time we can again expect another powerful bullish move again.
Conclusion:
Even though the priceline is having a very nice bounce from the long term support on weekly chart, however, we should use this support as stop-loss as well. If the next bullish rally will be started from here (as it seems to be) then a move up to 200 SMA can be expected that is at $135 at the time of writing.


Long ZEC: Initiating uptrendWeekly:
After a bullish divergence there is a first high, and then we see a finger pattern, that downwick which shows a price rejection. After that a low is formed, and price is rising again. The downtrend has clearly been broken and I suspect a move up to a new higher high.
The target would then a higher high between 100 and 113. It remains to be seen what the strength is, but I will take some profit at least around the lower area of this target zone.
Stochastic RSI is coming from a oversold condition and supports the idea of an upmove.
If the trend is just strong and healthy, I will stay in the trade and add to pullbacks. But then a new analysis will be posted.
Daily:
Afther the bullish divergence, there is a first high here as well, and then a first low that bounced on the EMA. Now it seems the uptrend is in play on this time frame as well. Price will probably be hovering between the value zone (EMA's) and +1 ATR.
MACD-Histogramd and EFI are rising, as is Stochastic RSI.
The stoploss will be a bit below the latest lows, around 2 ATR levels away.
Entry:
I will try to enter the trade in parts, in the price zone of 64-65.
Stoploss: 51.85
Target 1: 99,98
Target 2: 113
R/R ratio: 1:2,7 / 1:3,7


ZECUSDtaking a look at zecusd on the 4hr. looks to me as if cup and handle has formed.
aggressive buy would be the handle breakout
or wait for break of the cup. keep stops in place trade on.

ZECUSD H4: BEST level to SHORT IT 30%+ gains(SL/TP)(NEW) Why get subbed to to me on Tradingview?
-TOP author on TradingView
-15+ years experience in markets
-Professional chart break downs
-Supply/Demand Zones
-TD9 counts / combo review
-Key S/R levels
-No junk on my charts
-Frequent updates
-Covering FX/crypto/US stocks
-24/7 uptime so constant updates
ZECUSD H4: BEST level to SHORT IT 30%+ gains(SL/TP)(NEW)
IMPORTANT NOTE: speculative setup. do your own
due dill. use STOP LOSS. don't overleverage.
Tagged as LONG because I expect short-term
gains before reversal at/near 73 USD (BEARS).
🔸 Summary and potential trade setup
::: ZECUSD 4hour chart review/outlook
::: currently price is stuck in range
::: H*S setup in progress now
::: LS=RS=66 USD HEAD at 73 USD
::: neckline re-test near 52 USD
::: BEARS get ready to SHORT HIGH
::: that's where you want to SHORT IT
::: 73 USD - HEAD of H*S pattern
::: initial target BEARS is neckline
::: 30% gains possible in this setup
::: shorting near range highs makes sense
::: short-term bullish / more upside
::: 73 USD heavy resistance / SHORT IT
::: TP BEARS is re-test of neckline
::: 30% gains on sell side for BEARS
::: recommended strategy: SHORT IT / SHORT rips/rallies
::: ENTRY NEAR 73USD SL 4% TP1 20% TP2 30% // 52 USD
::: correction not over yet
::: good luck traders!
::: SHORT and get paid. period.
🔸 Supply/Demand Zones
::: N/A
::: N/A
🔸 Other noteworthy technicals/fundies
::: TD9/Combo update: N/A
::: Sentiment mid-term: BEARS/52USD
::: Sentiment outlook short-term: BULLS

ZEC/USD will rise!!!I see a bullish gartley pattern and expect a pull back to 55.85 for Zerocash. If it breaks yellow resistance in a bullish way, it can continue to its grow.
Targets:
-55.85
-58.7
-61.55
-63.30
Stop loss:
51.10
Have a nice day,
Berk.

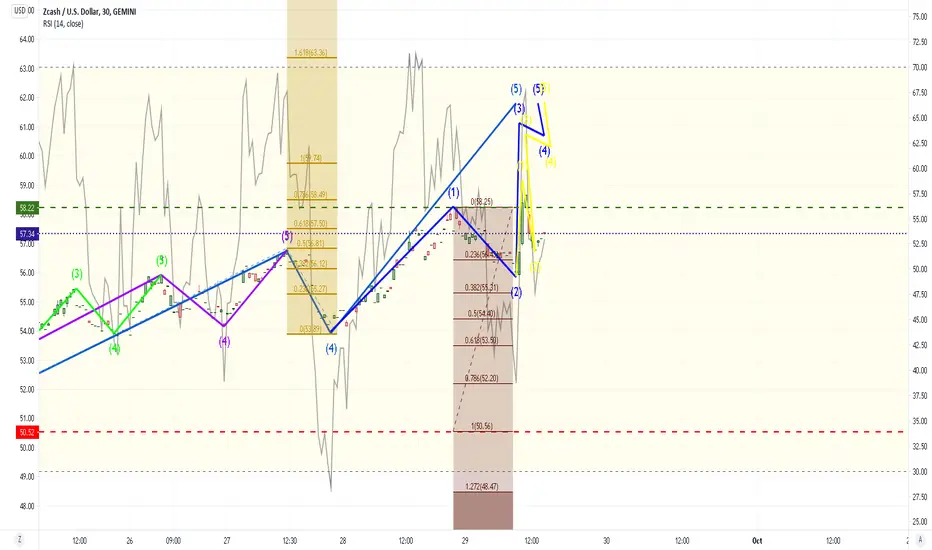
Is Z Cash finally showing a semblance of a comeback? ZECUSDWell I think so. At least for while we are in what appears to me to be Wave 5 with two subfractals. I am bullish on this one currently. I never short second sub waves, and almost never subwaves 4. Anyway, do your research - this is not financial advice ffs.
ZEC/USD - ATS SWING BACKTESTScript settings for 8H timeframe:
· Signal calculation type - "open"
-TP for Long - 28%
-SL for Long - 9%
-TP for Short - 28%
-SL for Short - none

Zcash: Possible Buying OpportunityThe price is at the support zone formed by 56.00$ and SMA200. Now it is the key support zone for the buyers. If the price can stay above this support, we should be ready to see a new upward movement toward the previous market high. If the price breaks the support zone, we will see the further downward movement toward 20.00$ support.
As for now, we can try to catch a possible upward movement using the current position of the price. The price is above the support zone and we have reasons to open a long position. The trading idea is based on the price reversal from the support zone.
The long trade has the following entry and exit points:
Buy above 58.50$
Stop below 48.50$
Profit Target at 98.50$
Risk per trade must be no more than 5% of the capital.
Disclaimer!
This post does not provide financial advice. It is for educational purposes only! You can use the information from the post to make your own trading plan for the market. But you must do your own research and use it as the priority. Trading is risky, and it is not suitable for everyone. Only you can be responsible for your trading.

ZECUSD W1: BEST Level BUY/HOLD 300%+ gains (SL/TP)(NEW) Why get subbed to to me on Tradingview?
-TOP author on TradingView
-15+ years experience in markets
-Professional chart break downs
-Supply/Demand Zones
-TD9 counts / combo review
-Key S/R levels
-No junk on my charts
-Frequent updates
-Covering FX/crypto/US stocks
-24/7 uptime so constant updates
ZECUSD W1: BEST Level BUY/HOLD 300%+ gains (SL/TP)(NEW)
IMPORTANT NOTE: speculative setup. do your own
due dill. use STOP LOSS. don't overleverage.
🔸 Summary and potential trade setup
::: ZECUSD week/candle chart review/outlook
::: long-term accumulation in progress
::: BULLISH falling wedge on weekly TF
::: throwback stage now not complete yet
::: mid/long-term SUPER BULLISH OUTLOOK
::: super strong chart bullish outlook
::: short-term more downside expected
::: accumulation mid range will get re-tested
::: required now before bull run can resume
::: BULLS should get ready to BUY PULLBACK
::: we are setting up for a strong move
::: within next few weeks max (3-6 weeks)
::: recommended strategy: BUY LOW 36/38 USD
::: TP BULLS is 250/350% gain BUY/HOLD setup
::: SWING trade setup / no fast gains here
::: BUY/HOLD / do not expect miracle gains
::: SL is 20% max
::: good luck traders!
🔸 Supply/Demand Zones
::: N/A
::: N/A
🔸 Other noteworthy technicals/fundies
::: TD9/Combo update: N/A
::: Sentiment mid-term: BULLS/PRZ/REVERSAL
::: Sentiment outlook short-term: BEARS


Z Cash might be waking up to some action. ZECUSDAt the beginning of 5th Wave Impulse here. Fibonacci levels for goals and expected time for completion. Invalidated if we drop below start of fractal. I will be watching this space carefully and modifying goals, as the market action unfolds.


Bullish on ZECAfter dropping from the ABCDE triangle not too long ago, I believe the latest green candles are a part of something new and exciting. Anyway, I longed ZEC!

Z Cash Going Down! ZECUSDLooks like we are zigzagging this one. There was a very small 5th wave that passed, meaning we are due for more drops.
Target's marked in red, Fib time indicates roughly when it might happen. It's drop, drop, drop time for this big boy.
