ZECUSD
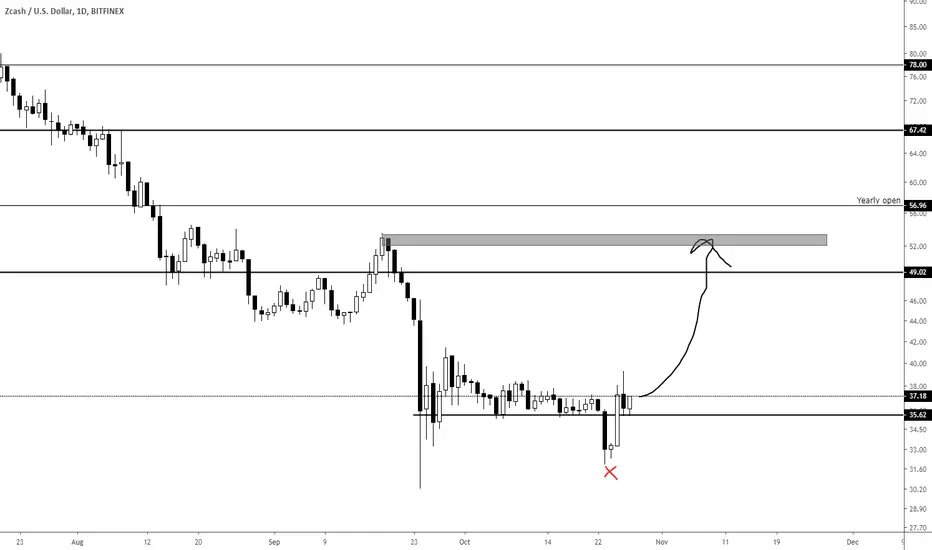


ZECUSDT long 15% min profit- Long in the buy green zone.
- Safe at TP1.
- Keep the rest for TP2 or more.


ZEC weekly log scale SharkUsually when measuring the retracements for potential harmonics we use the Linear Fibonacci scale but i think it might be acceptable to use the FIB tool adjusted for log scale in certain instances and this is one of them.
Pay no mind to the numbers auto generated by the Cypher tool as those numbers are only Linear scale retracements and the tool doesn't have a log scale adjusted option like the FIB tool does.
For those who would like to check the measurements themselves I have color coded each individual set of waves:
XA-B retrace in Orange
AB extension to C in Blue
BC extension to D in Green
X to C retrace to D in Black.
I have also marked the PCZ of the shark in the Blue Box if pattern is valid we will see a reversal between the 886 and 1.13 retracements.
Price-wsie that's between 37-15 dollars
Yea i know, that's a huge zone of reversal but that's the nature of a Shark pattern.
because of how big the reversal zone is it is too early to plot fib targets for the pattern for i currently don't have a definite price to fib from yet but something i can say is no matter where it reverses in this zone even a 0.382 and 0.50 retrace would yield a 100-200% move.
Alternatively I have also spotted a broadening and descending wedge marked in the green trendlines and are currently showing TDI-RSI bullish divergence from the lows back in December and February to our current lows a breakout of the wedge on it's own gives us a measure move back to around 300 if we're being conservative.
ZEC has never been my favorite coin but based off the technicals presented here i find no harm in trying to own atleast a few of them then forgetting about them to see how this pattern plays out.

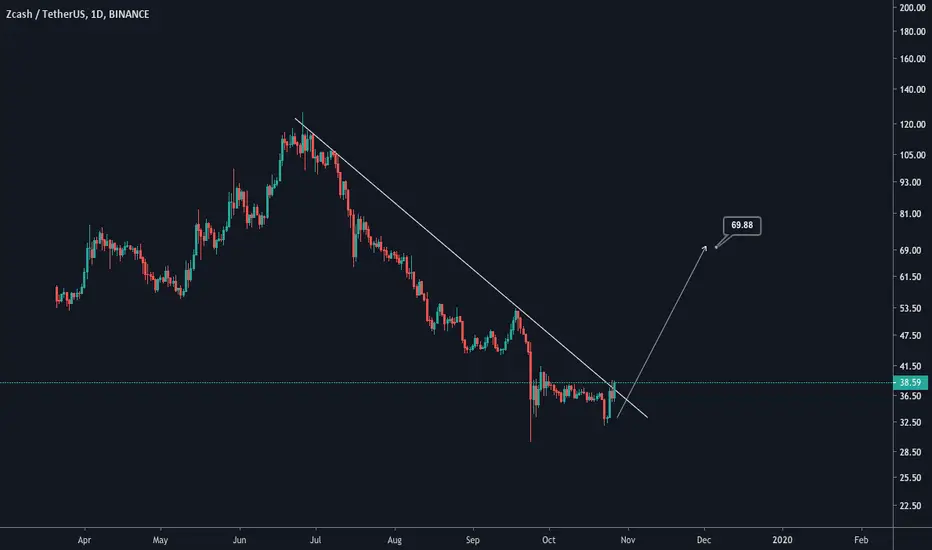
ZEC/USD long term entryZEC looking to start a trend reversal to the upside direction to end its bear market trend

Zcash has shown a strong reversal pattern !Hello, Traders!
Monfex is at your service and today we overview ZEC/BTC.
Diamond reversal pattern.
This pattern also finds support from RSI, the indicator has a certain upward trend, which is a good sign for bulls, but most likely not soon.
The support zone ~ 0,004350-4300
Share your thoughts, ideas about the market under the chart.
Watch for our Updates to be the first who gets well-timed signals !
GOOD LUCK AND LOTS OF PROFITS !!
Disclaimer
This report is for information purposes only and should not be considered a solicitation to buy or sell any trading assets. Monfex accepts no responsibility for any consequences resulting from the use of this material. Any person acting on this trade idea does so entirely at their own risk.

ZCash Analysis: Intraday Chart Patterns and 3 Things You Must KnConclusion for today’s Zcash Analysis: An upside breakout of the current pennant formation does imply continuation of bullish momentum. Upside target in this case would be the upper boundary of the bearish channel.
A logarithmic scale is used in today’s Zcash analysis on an intraday (6 Hour) timeframe. Over 3 months of price action shows a strong bearish trend in Zcash (ZECUSD), with a bearish channel plotted to provide perspective for the duration of price action (June 2019 till date).
The crossover of the 50 moving average below the 200 moving average on July 16, 2019 also supports evidence for the current bearish sentiment in Zcash. Three important things to keep in mind for the week of October 6, 2019 for any Zcash trade are the following.
(i) Immediate resistance between 44.52 and 53.45: The lower boundary of the region does coincide with the upper boundary of the channel, and is therefore expected to present a challenge to any bullish momentum. The most conservative Zcash trade (bullish) would therefore wait for price action to break above 53.45, while a less conservative bullish idea is to buy as soon as a break occurs above the upper boundary of the channel at ~44.52.
(ii) 50 and 200 moving average: The slope of both moving averages implies a strong downtrend and therefore limited potential for any bullish trade. A close above the 50 does improve the possibility of price retracing to the 200 moving average, which also coincides with the upper boundary of the channel.
(iii) Formation of what is described as a pennant chart pattern suggests a breakout to the upside and continuation of price upwards from the September 24, 2019 low of 42.74. A break below the lower boundary of the pattern would provide the opportunity for bearish momentum to accelerate and hence non confirmation of the chart pattern.


Zcash Analysis: Intraday Timeframe Bullish Opportunity.Conclusion for today’s Zcash Analysis: Bullish momentum in Zcash is expected to continue with the bottom of resistance (44.52) as the minimum target.
A log scale on the 6 Hour timeframe is used in today’s Zcash analysis. Inspection of intraday price action focuses primarily on data from June 2019 to current date.
The dominant chart pattern during the period mentioned above is a bearish price channel (tentative) which is used to provide perspective for price action since June 26, 2019 after price reached a peak of 108.03.
Also plotted along with the channel is the 50 and 200 moving average. July 16, 2019 saw the 50 cross below the 200 moving average adding to downside pressure in Zcash. The most recent test of the lower boundary of the channel occurred on September 24, 2019 when price reached a low of 30.19 with continuation to the downside.
The relative strength index (RSI) does provide additional evidence of the 30.19 price level acting as support via momentum reaching the oversold boundary. This therefore implies that bullish momentum in Zcash should become the dominant force even if temporarily.
As a result, any Zcash trade to the downside is currently limited in potential. 53.45 and 44.52 is marked on the chart as immediate resistance. Continuation of bullish momentum from the 30.19 price level is therefore expected to run into resistance at the lower boundary (44.42) as a minimum expectation.
Additional confirmation of movement to the upside involves the 50 moving average crossing back above the 200 moving average (MA).


ZCASH double bottom... maybe.ZEC / Z CASH
- Privacy coin
- Low circulation
- See if $43 holds as support
- Potential double bottom setup for massive breakout run
- Tight range / Squeeze
- $26 is next support if failed to breach
- I think this coin will run hard when it breaks free
Drop a comment below :)


