ZEC US leaked bill to eliminate anonymous crypto projectsA leaked copy of US draft bill proposes to eliminate anonymous crypto projects.
DAOs, DeFi and exchanges will be required to legally register in the US!
My entry area for ZEC is $69.
Looking forward to read your opinion about it.
ZECUSD

ZECUSD ❕ upward channel is formedThe price broke up 200MA on 1H Timeframe.
Zcash holds the upper boundary of the downward channel.
The price formed the upward channel.
Volatility declined like volumes of trading.
I expect that the price will growth after fixing above the support level.

ZECUSDT - SETUPZECUSDT's price squeezes at 89.7$ into a symmetrical triangle and reaches the apex. But the problem for Bulls is EMA21 lying at a critical resistance zone, if they succeed to break that level we may find a good upside but there is an equal probability that the price may break down to establish an undercut towards 86.0$ and then find the rhythm. Accumulation can be done in that zone. Good Luck

Zcash (ZEC) formed bullish BAT for upto 134% big moveHi dear friends, and welcome to the new update on Zcash (ZEC).
Previously on a long-term monthly view, ZEC formed bullish Shark , and we had a nice trade.
This time on a weekly time frame, ZEC has formed huge bullish BAT pattern.
Note: Above idea is for educational purpose only. It is advised to diversify and strictly follow the stop loss, and don't get stuck with trade

ZECUSD ❕ above the downward channelZcash is above the point of control.
ZEC is retesting the 200MA and the upper bound of the descending channel on the 1H Timeframe.
A bullish divergence is forming between the price and trading volumes.
I expect that the price may continue to rise after fixing above the resistance level.

$ZEC - Retracing to Bullish OB Then Attack Liquidity Above *SMT**SMT* = Smart Money Theory = everything you think that is not retail related to trading. First, SMT does not believe that triangles, wedges , trendlines , channels, harmonics, etc. has any effect on how price reacts. I'm Sorry, but you won't convince me that Bitcoin knows it has created a triangle and that it knows how to react from that? It does and will remember price levels, that's it. The second is to recognize that the price is not random, it is set by an algorithm controlled by those that control the asset. The Third thing to remember is price will move toward attacking where there is Liquidity (Equal Highs, Equal Lows, phantom Trendlines etc.) and Balance (Fair Value Gaps, Liquidity Voids.) That's the basics. The rest is very unique in the vocabulary you need to have and the concepts that wrap around these ideas.
TLDR;
Entry: 92.3-92.5
Stop Loss: (88.5-89.2 Depending on Broker and how much your willing to give up below the Bullish Order Block)
Take Profit 1: 96.3-96.4 20-25% of profit removed here (Move SL to 90)
Take Profit 2: 97.4-97.6 (Bulk of the trade off here up to 85%-98% of the trade, move stop into break even)
Take Profit 3: 99.5-99.6 (127% Extension meets the Fair Value Gap Above the equal highs/Liquidity Line
On the Hourly it appears that after price had broker the structure of the lower dealing range, it retraced back down to the breaker of that range and continued up until it hit equal highs with the price before th major drop off. These equal high are creating artificial Liquidity meaning that most traders who see the equal highs automatically think "Resistance" It may be met with some resistance but smart money or Institutional traders know that there are retail traders that have their shorts sitting there with, most likely, a short stop loss.... Or a buy stop with a short stop loss. I see this everytime, The price will come trigger the buy stop people and to take out the SL of the people Shorting with a limit, then it falls more to take the buy stop traders SL out, then continue up to find an imbalance or liquidity. And there's an imbalance at exactly the 127% extension.If there's a slight chance that doesn't happen I do have multiple take profits set up, but more than likely this will be the scenario. I've seen play out so many times that I know there's players in the room with large amounts of money able to manipulate the charts right when they want to. If this doesn't Happen, I'LL be Surprised.
Good luck and happy trading :)

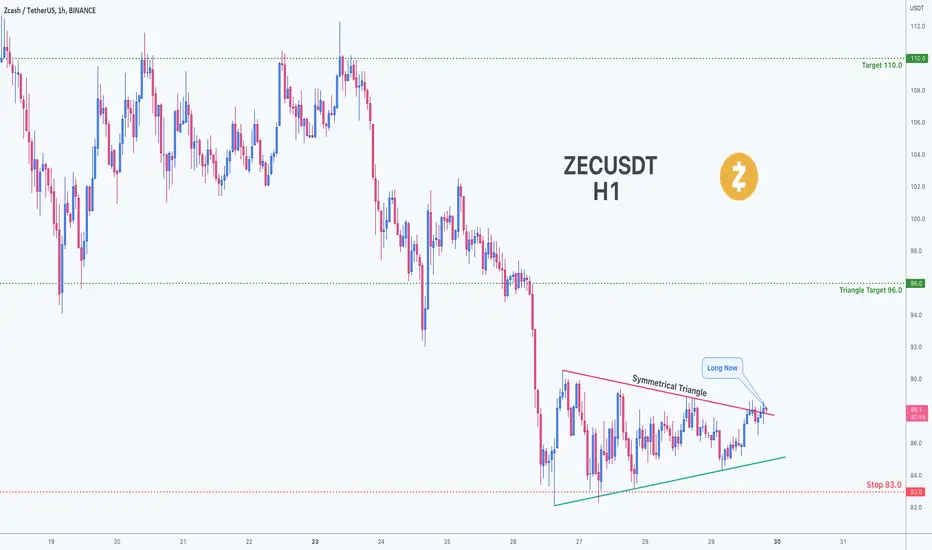
Symmetrical Triangle on ZECUSDT Based on technical factors ( Symmetrical Triangle ) there is a long position in :
📊 ZECUSDT
🔵 Long Now 88.1
🧯 Stop loss 83.0
🏹 Target 1 96.0
🏹 Target 2 110.0
💸Capital : 1%
We hope it is profitable for you ❤️
Please support our activity with your likes👍 and comments📝
short trem zecafter exiting each side of this flag pattern . in the same direction, it is appropriate to get a deal.

ZEC looks good... ZEC looks good... bullish structure - can break up again...there is sometimes double bottom formation which I am also expecting. GL
NOT FINANCIAL ADVICE

Descending Broadening Wedge Partial Decline at an .886 RetraceWe have a Descending Broadening Wedge with a Partial Decline on Zcash at an .886 Fibonacci Retracement with some RSI Bullish Divergence on the Daily.

ZECUSD ❕ price under the rangeZEC is moving in a downward channel.
Zcash under the trading range.
Price has fixed below the 50MA on the 30m Timeframe.
Trading volumes show no interest in price growth.
I expect that the price may test the resistance level, and after fixing under it, it may continue to fall.

Maybe OI goes higher and then Zcash ZEC price goes higher also"Privacy is the right to a free mind," Snowden said. "Without privacy, you can't have anything for yourself. Saying you don't care about privacy because you have nothing to hide is like saying you don't care about free speech because you have nothing to say."

ZCASH Can Become Bullish Even In This Bearish PatternIf We Observe ZCASH in Bigger Timeframes like Weekly, We can See That the Price Is in a Big Descending Triangle! So you Might Think to yourself that the Price is gonna Decrease,But there is a Bullish Sign as well! There is a Regular Bullish Divergence (+RD) On MACD which will Determine our Calculations. The Chance of being Bullish Is High So we can Safely Say that the price will Increase Soon & WILL break the Triangle. The Next Possible Resistance is around 280$.
-ZCASH is in a Big Descending Triangle (Weekly Timeframe)
-(+RD) On MACD will Change the Situation
-Price will become Bullish
-Resistance at 280$.

Zcash ZEC Entry Range, Price Targets and Stop LossZEC/USDT
Entry Range: $104 - 115
Price Target 1: $133
Price Target 2: $151
Price Target 3: $170
Stop Loss: $94
short targets reached

ZEC / BTC ----- this chart predicted the total market cap topthis isn't anything in-depth
but ive been watching this chart ever cense the touch of the channel
and that was exactly when BTC touched 65k and the total cap toped out.
ZEC/BTC is the longest un-broken trend I've ever seen in a crypto chart
I'm not comparing BTC movement to this, I'm comparing the alt market in general
on the other hand most alt/btc charts did and are doing a lot better then ZEC/BTC
so im only comparing the tops when this channel touches the trend line.
maybe leave it in the charts category you will glance at once a week at least
once this channel breaks.... obviously to the upside (if ever) this might lead to the biggest alt market ever seen.
thanks for reading
goodluck

ZECUSD ❕ decline of trading volumesZcash is moving in an uptrend channel.
Volatility has declined.
The price is above the liquidity zone.
During the whole movement in the uptrend channel, trading volumes declined, although the price has only increased.
I expect that ZEC may fall in the liquidity zone after fixing under the lower border of the channel.

ZEC - 1:7 Short📉⭐️ BTC bearish
⭐️ Trend is bearish
⭐️ Level is 8 days old
⭐️ 3rd touch
⭐️ When we touched the level, pulback was insignificant
⭐️ 46 ATR
⭐️ Under VWAP
Will enter when price squeezes to the level on lower timeframes, the base will form and the strip will get faster.
Fix profit by parts:
1% - 1/3
2% - 1/3, stoploss to breakeven
What's left, hold to the maximum
What do you think of this idea? What is your opinion? Share it in the comments📄🖌
If you like the idea, please give it a like. This is the best "Thank you!" for the author 😊
P.S. Always do your own analysis before a trade. Put a stop loss. Fix profit in parts. Withdraw profits in fiat and reward yourself and your loved ones

ZECUSD ❕ correction before growthAfter Zcash exited the uptrend channel, the price reached the resistance level on the descending volumes. I expect that after the price fixes under the support level, the fall may continue until the upper boundary of the uptrend channel is retested.


ZECUSDTPERP is going longAfter this hard drop on market zec is one of the best coins to trade i think. It's on its trend level support. i can be buyable between 149,50 and 150,50... Sl is 148,90. Tp is gonna be 182 so fast. NOT-TRADE-ADVICE

Zcash Cope and Hope lines for the futureWhy Is Crypto Down? Inflation Worries. ZCash (ZEC) Synthetix (SNX) Price Prediction | Market Update. Do we know Why Is Crypto Down? Is there any place for Worries about Inflation? We use graphs and data to find out in our Market Update. Also we give ZCash (ZEC) and Synthetix (SNX) Price Prediction
www.youtube.com

$ZEC Zcash to fall 50+% from these levelsIf you look at the price action on the Zcash chart, price just tested and rejected the resistance at $163, which now sets up the possibility to fall to $56-70 as the next supports. If price can't hold there, then it can fall more. Just from looking at the chart, my interpretation leans towards price finding the $26 support before bouncing.
I think that's likely to play out over the coming weeks. I put pivots on the day for key dates to watch for changes in price action.
Let's see what happens.

💡Don't miss the great buy opportunity in ZECUSD @ElectricCoinCoTrading suggestion:
". There is a possibility of temporary retracement to the suggested support line (152.5).
. if so, traders can set orders based on Price Action and expect to reach short-term targets."
Technical analysis:
. ZECUSD is in a range bound, and the beginning of an uptrend is expected.
. The price is above the 21-Day WEMA, which acts as a dynamic support.
. The RSI is at 55.
Take Profits:
TP1= @ 172.5
TP2= @ 183.9
TP3= @ 199.5
TP4= @ 211.7
TP5= @ 230.1
SL= Break below S2
❤️ If you find this helpful and want more FREE forecasts in TradingView
. . . . . Please show your support back,
. . . . . . . . Hit the 👍 LIKE button,
. . . . . . . . . . Drop some feedback below in the comment!
❤️ Your support is very much 🙏 appreciated!❤️
💎 Want us to help you become a better Forex / Crypto trader?
Now, It's your turn!
Be sure to leave a comment; let us know how you see this opportunity and forecast.
Trade well, ❤️
ForecastCity English Support Team ❤️
