low time-frame ZEC scalpalthogh price has been in a local uptrend , I notice a massive selling volume on BTC pair. if BTC doesnt go up unexpectedly we can expect a minor decline in ZECUSDT.
MAKE SURE YOU FOLLOW OUR CONTENT ON ALL PLATFORMS.
ZECUSDT

ZECUSDT - Resistance Breakout!ZECUSDT (1D Chart) Technical analysis
ZECUSDT (1D Chart) Currently trading at $140
Buy level: Above $137
Stop loss: Below $103
Target 1: $158
Target 2: $172
Target 3: $190
Target 4: $250
Max Leverage 2x / Spot Market
Always keep Stop loss
Follow Our Tradingview Account for More Technical Analysis Updates, | Like, Share and Comment Your thoughts

Zcash (ZEC) - March 9Hello?
Traders, welcome.
If you "follow", you can always get new information quickly.
Please also click "Like".
Have a good day.
-------------------------------------
(ZECUSD 1W Chart)
If the price holds above the 130.82 point, it is expected to turn into an uptrend.
However, since the volume profile section is formed over the section 162.04-301.37, it is expected that the upward trend will accelerate when it is out of this section.
-----------------------------------------
(ZECBTC 1W chart)
Above the 0.005954 point: Expect to create a new wave.
As it appears that the Bollinger Bands have entered the final convergence phase, we expect movement outside the range of 0.002058-0.004650 in the near future.
------------------------------------------
We recommend that you trade with your average unit price.
This is because, if the price is below your average unit price, whether the price trend is in an upward trend or a downward trend, there is a high possibility that you will not be able to get a big profit due to the psychological burden.
The center of all trading starts with the average unit price at which you start trading.
If you ignore this, you may be trading in the wrong direction.
Therefore, it is important to find a way to lower the average unit price and adjust the proportion of the investment, ultimately allowing the funds corresponding to the profits to be able to regenerate themselves.
------------------------------------------------------------ -------------------------------------------
** All indicators are lagging indicators.
Therefore, it is important to be aware that the indicator moves accordingly with the movement of price and volume.
However, for convenience, we are talking in reverse for the interpretation of the indicator.
** The MRHAB-O and MRHAB-B indicators used in the chart are indicators of our channel that have not been released yet.
(Since it was not disclosed, you can use this chart without any restrictions by sharing this chart and copying and pasting the indicators.)
** The wRSI_SR indicator is an indicator created by adding settings and options to the existing Stochastic RSI indicator.
Therefore, the interpretation is the same as the traditional Stochastic RSI indicator. (K, D line -> R, S line)
** The OBV indicator was re-created by applying a formula to the DepthHouse Trading indicator, an indicator disclosed by oh92. (Thanks for this.)
** Support or resistance is based on the closing price of the 1D chart.
** All descriptions are for reference only and do not guarantee a profit or loss in investment.
(Short-term Stop Loss can be said to be a point where profit and loss can be preserved or additional entry can be made through split trading. It is a short-term investment perspective.)
---------------------------------

zecusdtMost likely we will do this move and at the same time there will be divergence
This move will also be possible
Depends on Bitcoin


Zcash vs Tether Bullish Hammer (90%+ Potential)We have hammers everywhere here... A bullish candle based on candlestick charts.
Notice the blue down trendline being broken today.
At the same time we have a bullish RSI as we go above EMA10.
I did it all for you once again.
Here we have the targets (in yellow) and support (in blue)...
Thanks for the support.
I am wishing you a prosperous week.
I hope you can achieve your goals.
If you are looking for money, I hope you make money.
If you are looking for freedom, I hope you gain freedom.
If you are just looking for entertainment, I am hoping that you are being entertained.
Thanks a lot for reading.
I've reached the limit for today.
Namaste.

ZECUSDT - Bull flag pattern long positionZECUSDT Pair
The chart shows a bull flag pattern with a breakout and support retest.
For further continuation of growth, Bitcoin FLAT is also suitable for us!
Goals are indicated on the chart ☑️
Deal (SPOT) - Medium-term
ZECUSDT - Bull flag pattern long position

zecusdt zecusdtperpIf the monthly candle is also closed
Depending on the style of supply and demand, there are two important levels of return that are indicated by a rectangle.
And the figure on the right shows the fractal that we are completing monthly
It is better to look for return signs at 75 and 61 prices

Zcash versus Dollars on the Pononiex Crypto Altcoin ExchangeSupply side will dry up when the Electric Coin Company confirms the conversion to Proof of Stake
Proof of Work miners will be triggered into Holding their coins in order to claim stakes in the future, rather than liquidating them on the market
Zcash will also roll-out an upgrade to Have Transaction Privacy by Default, transparency as an opt-in feature
Lastly the Breakthrough protocol upgrade to RZKSNARKS - Recursive Zero-Knowledge Succinct Non-Interactive Argument(s) of Knowledge
3,550 new zcash emitted daily, inflation by % is 11, inflated global 24-hour volume remains near 250-400 million dollars
the current circulating supply is 11.7 million ZEC, by the end of the year it will be 12 million
Price Target is $990 to $1770 within 90 days

Zcash | take eyes on it and wait for herif you use it on spot , you dont need to worry about that stoploss , because the target I showed you is where price must go even if she willing to fall into the hell after

ZEC - Zcash the brother of DASHThe brother of DASH can break $20,000 this year. I believe that privacy will become an important part of the cryptocurrency market and ZEC, DASH and Monero will all be valuable coins

ZEC is Approaching Near to Multi-Year SupportThe Back Ground and Multi-Year Trend Line
After making an ATH of 370$, it shed almost 77% of its gains, a massive downward move. It almost loses 92 of value which is gained in the bull run. And after that, in the next attempt, it again touches the 305$ level, and history is repeating itself; it's near to shed 92% of its last bull run gains. On the downside, a multiyear well-established ascending trend line holds the price upward, and the price is rejected from this level five times, which proves its strength. Furthermore, RSI is near the oversold level, and it bounces back every time it comes to this level. Lastly, it's trading within a wedge, and the price is hovering near the support zone.
Point:
Price reaches the multiyear support, which is also a lower level for the wedge. RSI is hovering near the oversold level, and every time in the past, we see a bounce back from this level, and the bull run starts from here.
Pay Attention
It will be a good buying opportunity when the price visits the 0.40 level but pay close attention to the daily close; it should not breach the lower level. Rejection and its confirmation from this level open the doors for a new medium-term bull run that leads the price to TP1 (280$)
Risk / Reward and Holding Period
On the downside, the only risk is BTC breaking below $40K that can pull the price of ZEC below its multiyear support line. Instead of stop-loss DCA is recommended @ 80$, well there are few chances that it falls to this level. Hold it for atleast one quarter to get Return where the first target is 280$
It is not financial advice; always do your research.
Please, feel free to ask your question; write it in the comments below, and I will answer.

TORN Tasty Short OpportunityReady to take a dive. Momentum is in favor of the bears this is the bulls last rally.

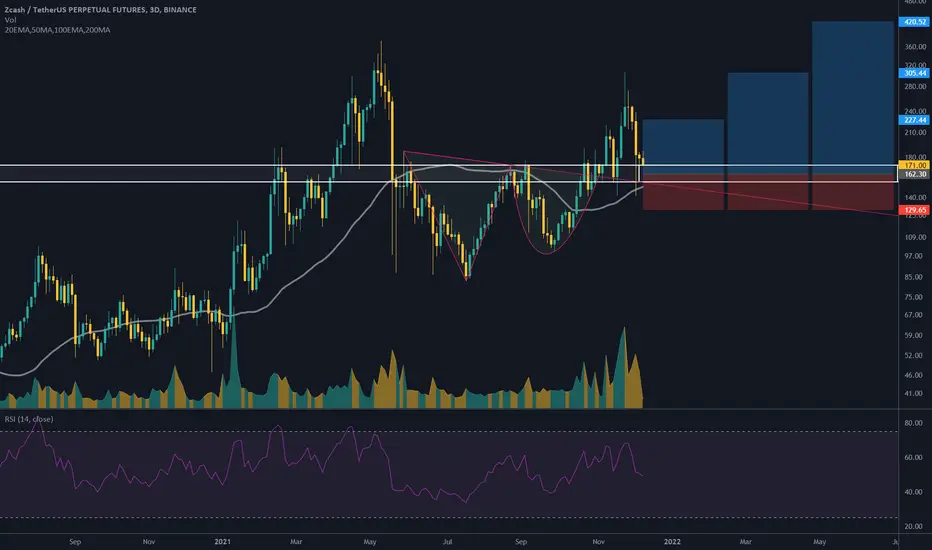
$ZEC/USDT 3D (Binance Futures) Adam & Eve breakout and retestZcash is pulling back towards 50MA support where it is very likely to bounce and resume the up-trend.
Current Price= 171.00
Buy Entry= 170.90 - 153.90
Take Profit= 227.44 | 305.44 | 420.52
Stop Loss= 129.65
Risk/Reward= 1:2 | 1:4.38 | 1:7.91
Expected Profit= +40.14% | +88.19% | +159.10%
Possible Loss= -20.12%
Fib. Retracement= 0.618 | 1 | 1.414
Margin Leverage= 1x
Estimated Gain-time= 7 months
Website: z.cash
Contracts:
#Mainnet
#BEP20 0x1ba42e5193dfa8b03d15dd1b86a3113bbbef8eeb
#BEP2 ZEC-93E
ZEC DESCENDING UPPER TRIANGLE PATTERN!Hi! this is my ZEC/USDT IDEA
I got a feeling we will see a breakout soonl.
Hope you will like it! if
you have any feedback about the chart pls feel free to tell me:)
MY IDEA ONLY NOT A FINANCIAL ADVICE!!!
Love Yall :)

zecusdtZecash sitting nicely above the uptrend support line
RR is good TBH
I'm buying here
targets and stop-loss is on the chart
KUCOIN:ZECUSDT

Zcash (ZEC) Analysis Updated 07/03/2021this is an update of Zcash Analysis which we did on 01/02/2021
as we can see our Hidden Bullish Divergence Implemented, price made a rally and higher high, touched the TP Zone Green Box, where we had our 161.8% level Fibonacci projection Triggered.
price corrected itself and retraced down to the past ATH and Top of our Ascending Channel, so we got our confirmation for the 261.8% level of the same Fibonacci Projection, which is our new higher TP (250USD)
as of now we have total of 3 targets where the 1 TP is the 161.8% of the same Fibonacci Projection where it is very obvious and 2 TP is also well confirmed now.
we can target the 3 TP (315USD), after a retracement from 2TP or if the Bull pressure was high, we can simply Trill our Stop Loss and target our ultimate Target.
i have linked the previews analysis too.

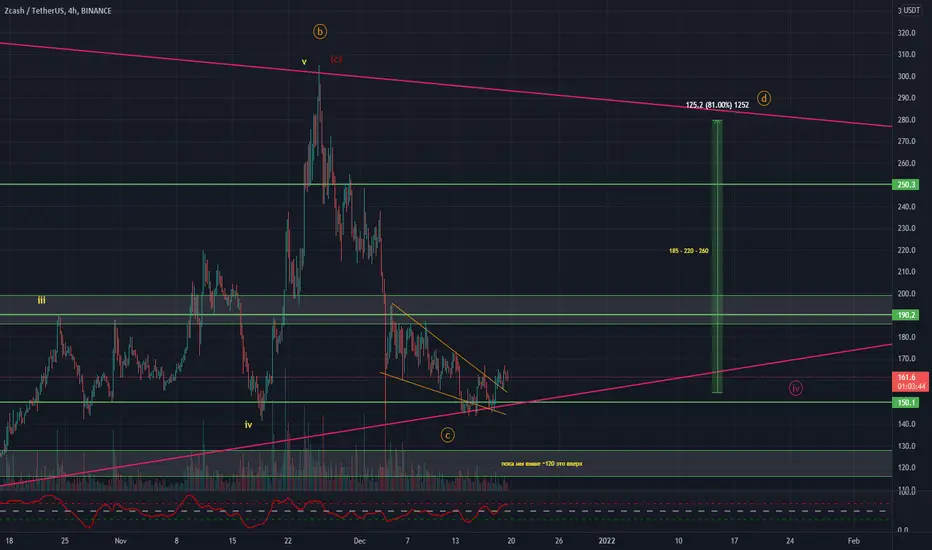
ZECUSDT AnalysisHello friends.
Please support my work by clicking the LIKE button(If you liked).Thank you!
Everything on the chart.
open pos: market and lower
target: 185 - 220 - 260
after first target reached move ur stop to breakeven
stop: im w/o stop (depending of ur risk). ALWAYS follow ur RM .
risk is justified
Good luck everyone!
Follow me on TRADINGView, if you don't want to miss my next analysis or signals.
It's not financial advice.
Dont Forget, always make your own research before to trade my ideas!
spot & hold ZECevery time such as a crocodile buy cheep
and hold.
now our strategy in 2022 is SPOT.
we buy ZEC/USDT for 30% profit

ZECUSDT Triangle formation!ZECUSDT (1H Chart) Technical analysis update
ZEC/USDT currently trading at $153.9
zec forming symmetric triangle in 1h chart, if triangle breakout we can expect up move in zec.
Buy level: Above 154.5 (only buy after symmetric triangle breakout
TP 1: $158
TP 2: $163
TP 3: $170
TP 4: $180
Stop loss:$146
Max Leverage: 2x


ZECUSDTCame out of a downtrend forming a rounded bottom and recently broke a strong horizontal resistance at $148 level. Expected a move to the upside.
