Zendesk: M&A News pop!1Zendesk
Intraday - We look to Sell at 100.59 (stop at 107.67)
This stock has recently been in the news headlines for a private equity buyout imminent. Price action reacted by popping higher on yesterday's trading. Sentiment remains negative despite the pull-back higher in prices. Current price action faces resistance at the 61.8% Fibonacci retracement level of the 130.58-54.52 move. Resistance could prove difficult to breakdown. We therefore, prefer to fade into the rally with a tight stop in anticipation of a move back lower.
Our profit targets will be 72.75 and 60.00
Resistance: 100.00 / 110.00 / 130.00
Support: 72.00 / 54.00 / 40.00
Please be advised that the information presented on TradingView is provided to Vantage (‘Vantage Global Limited’, ‘we’) by a third-party provider (‘Signal Centre’). Please be reminded that you are solely responsible for the trading decisions on your account. There is a very high degree of risk involved in trading. Any information and/or content is intended entirely for research, educational and informational purposes only and does not constitute investment or consultation advice or investment strategy. The information is not tailored to the investment needs of any specific person and therefore does not involve a consideration of any of the investment objectives, financial situation or needs of any viewer that may receive it. Kindly also note that past performance is not a reliable indicator of future results. Actual results may differ materially from those anticipated in forward-looking or past performance statements. We assume no liability as to the accuracy or completeness of any of the information and/or content provided herein and the Company cannot be held responsible for any omission, mistake nor for any loss or damage including without limitation to any loss of profit which may arise from reliance on any information supplied by Signal Centre.
Zendesk
Golden cross forms on Zendesk's chart.If history is any guide, there may be good fortune ahead for shares of Zendesk , a so-called "golden cross" has formed on its chart and, not surprisingly, this could be bullish for the stock.
Many traders use moving average crossover systems to make their decisions.
When a shorter-term average price crosses above a longer-term average price, it could mean the stock is trending higher. If the short-term average price crosses below the long-term average price, it means the trend is lower.
The 50-day and the 200-day simple moving averages are commonly used.
The golden cross occurs when the 50-day crosses above the 200-day . This could mean the long-term trend is changing.That just happened with Zendesk , which is trading around $126.05 at posting time.
Seasoned investors don't blindly trade Golden Crosses.
Instead, they use it as a signal to start looking for long positions based on other factors, like price levels and company fundamentals & events.
For seasoned investors, this is just a sign that it might be time to start considering possible long positions.
With that in mind, take a look at Zendesk's past and upcoming earnings expectations:
Do you use the Golden Cross signal in your trading or investing? Share this article with a friend if you found it helpful!
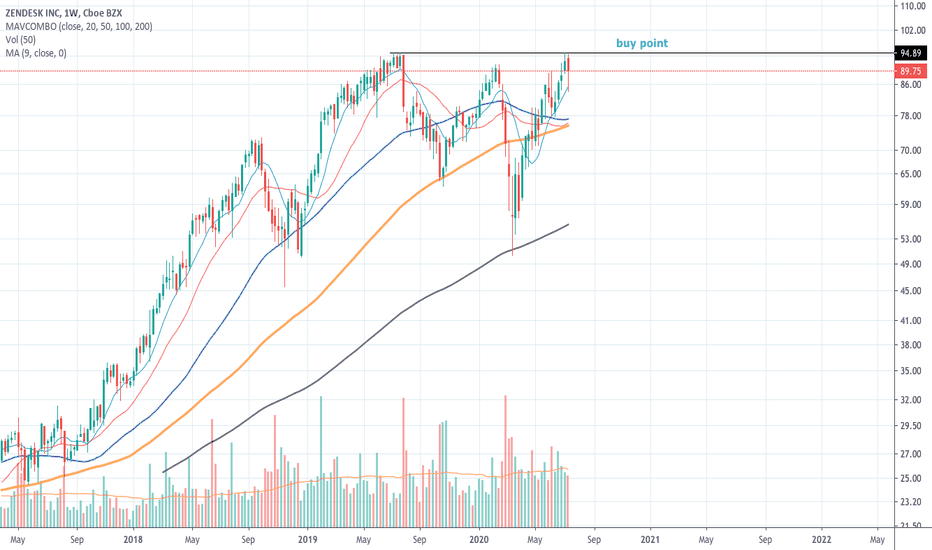
Zendesk $ZEN$ZEN is hitting the pivot to breakout. needs to hold above to get in. watch out for a breakout.
12 months Consensus Price Target: $94.10
if you find my charts useful, please leave me "like" or "comment".
Please don't trade according to the ideas, rely on your own knowledge.
Thx


