GOLD → There is no big buyer in the market. Moving to 2300?FX:XAUUSD continues to update lows amid a bearish wave based on fundamental (economic) reasons. The market after a pullback may be willing to continue falling.
On D1 the outlook and situation is in the hands of bears. There is no big buyer on the market, who could turn the market around (not yet). Accordingly, a correction is forming due to liquidity captured by the false breakdown relative to 2335. Within the counter-trend correction, the price may test the density zone of 2354 before further declines. A pre-breakdown consolidation or a quick retest of 2335 will form the potential for further decline.
Resistance levels: 2354, 2374
Support levels: 2335, 2306
False breakdown and stop from 2335 is most likely temporary. Keep an eye on local resistances, a false breakdown could be a motivation for sellers.
Regards R. Linda!
Zigzag

GBPUSD → A false breakout draws a pin bar. Sellers are winning FX:GBPUSD is forming a test of the resistance level at 1.271. There is a struggle for the level during the week and apparently the sellers are winning (pinbar is formed and consolidation under the level).
Technically, the downtrend was broken earlier, but there was no confirmation of the boundaries and confirmation of the trend change, so the area of 1.271 may become the zero point for the beginning of the correction. The currency pair on the background of fundamentally strong dollar may go down to 1.2664 with the subsequent breakout and fall to 1.257. Overall, the environment is unstable due to high inflation and regulators' decisions.
Resistance levels: 1.271, 1.28
Support levels: 1.2664, 1.257
I expect the beginning of correction to the support area, although the bearish channel was broken earlier, but there are no strong bulls in the market yet.
Regards R. Linda!

GOLD → The mood has shifted to bearish. A correction?FX:XAUUSD is forming a bearish wave, within which it is declining from 2400 to 2350. The price is testing strong support amid the changing sentiment.
Within a bullish trend, after testing the high of 2450, the market catches up with a correction wave based on fundamentals. The market is caught by a wave of sell-offs, which can be continued after a pullback and retest of local areas of liquidity. From 2354 we expect a rebound to the above-mentioned areas and further we should follow the price reaction to the liquidity areas.
Initial Jobless Claims and Purchasing Managers' Index are ahead. Traders are neutral towards the dollar, but amid the general policy, the dollar index may get support, which may have a peculiar effect on the gold, until the market finds new reasons to rise.
Resistance levels: 2374, 2383, 2397
Support levels: 2354, 2336, 2306
Technically and fundamentally the market is still bullish, but a correction is forming within the uptrend, which may take a little longer.
Regards R. Linda!

USDCHF → False breakdown gives bullish momentum ↑FX:USDCHF is forming a false breakdown of range support and uptrend, which opens the market to buy potential. CHF is weakening stronger than the dollar and this could support the uptrend.
On D1, the price tested the MA-50 ascending average with a false breakdown, as well as a strong support area at 0.900. Liquidity capture and candlestick set-up form the price reversal and bullish momentum, which, from the point of view of trading inside the range, can lead the price to the upper boundary - 0.9216
Resistance levels: 0.910, 0.915, 0.9216
Support levels: 0.9075, 0.900
A break through the nearest zone 0.910 will accelerate the price strengthening. The bullish trend may continue.
Regards R. Linda!

📈 Focus on GOLD ( XAUUSD ) !www.tradingview.com
📈 Focus on XAUUSD!
🚀 On the H4 chart, XAUUSD has tested the significant 2370 resistance, which aligns with the golden Fibonacci ratio. Technically the market is still bullish.
🔼 If the price breaks above the 2370 resistance, the next target is 2395.
🔽 If a correction happens, the price might drop to 2330 and the 38.3 Fibonacci level.

BITCOIN → The bulls are ready to break resistance. 71K or 73K?BINANCE:BTCUSD , after a shake-up (False Breakout), relative to the liquidity zone of 59-60K, is forming a bullish impulse, which is also favorably influenced by fundamental reasons
On the local timeframe there are signs of the end of the locational correction and the beginning of the formation of the third wave. The bullish trend is starting to revive, but there are quite a few key areas ahead that can hold the level.
Yesterday, after the bulls held the defense above 64500-65000, the buyers started to push the price up and tested the resistance 67250 with a false breakdown. There is no fall after the false breakdown, a pre-breakdown consolidation is forming. Bulls are still collecting positions with the breakout target and are ready to go all the way.
On W1 the picture is very interesting and this correction has the character of consolidation. Huge volume is being collected from the strong buyer side. The distribution phase that will start after the consolidation is over could continue the bullish trend if the buyers are persistent.
Resistance levels: 67250, 71500, 73700
Support levels: 65250, 64500, 61500
Bitcoin looks quite bullish right now. High interest, favorable fundamental background can affect the strengthening of the price. At the moment it is worth paying attention to these levels, the breakthrough of which may give a continuation of movement, the targets are indicated on the chart
CME:BTC1! CRYPTOCAP:BTC CRYPTOCAP:TOTAL
Regards R. Linda!

Bitcoin - Pullback is required, buy again lower!In my previous analysis, I suggested buying cheap Bitcoin at 67k and now the price has gone up to 71k in a single day:
What now? Will this pump continue? It's possible, but I am waiting for lower prices because the current pump has created a huge FVGAP on the daily chart. These GAPS tend to be filled sooner rather than later. What's more, the price hit a critical point of resistance that you can see on the chart. We have 2 parallel channels, and the price is currently at this critical point. My suggestion is to wait for lower prices, 68k seems to be a strong support, but also the bottom of the ascending blue parallel channel.
Bitcoin is very bullish on the weekly chart, so there is a strong probability of prices above 100K this year. What is my ultimate target for Bitcoin for the whole bull market? I will soon share my special technical analysis on the monthly chart, and you will see a detailed graphic representation of it.
Let me know what you think about my analysis in the comment section, and please hit boost and follow for more ideas. Trading is not hard if you have a good coach! Thank you, and I wish you successful trades.

GOLD → Traders don't know what to do. Struggle for 2417FX:XAUUSD is stopping and forming a consolidation between 2400-2450, but at the moment the consolidation resembles a descending triangle. What's going on?
The price breaks the local ascending support line in the correction phase, which makes traders panic (some start selling, others start actively buying). But the candlestick setup suggests that the buyer is still in the game. The market maker may shake down to liquidate traders. A retest of 2407-2400-2397 (ascending support line) is possible before further growth. The trend is bullish ( locally and globally ), while the market is waiting for the FOMC speech, which will be held today at 18:00GMT
Resistance levels: 2417, 2426
Support levels: 2406, 2400
FOMC comments may warm up the crowd. Gold traders are in neutral stance for now and forming a range due to lack of understanding of the local environment. Consolidation above 2417 will renew the bullish potential.
Regards R. Linda!

GOLD → Fighting for levels. When do we go to 2500?FX:XAUUSD is forming a correction to the liquidity area after ATH update. To continue the growth the market needs to get confirmation from the bulls. The price still looks quite confident.
A corrective wave is being formed, confirming the end of the impulse bullish wave and the market's readiness to go for a fifth, which in general determines the medium-term prospects for us. The strong support area is the zones: 2417, 2400. Most likely, before further growth, the market may test these liquidity zones, but, a good signal and confirmation of readiness to go up will be the closing and consolidation of the price above 2417 and 2431.
Support levels: 2417, 2497, 2397
Resistance levels: 2431, 2437, 2450
Now there is a struggle between traders for strong levels, fundamentally and technically the bulls have the advantage, it is necessary to wait for confirmation on the chart, in order to take some measures for trading.
Regards R. Linda!

GOLD → ATH Update. What are the reasons? Next up is 2500? FX:XAUUSD has been breaking through ATH and testing 2450 since the opening of the session. Possible reasons could be fundamentally weak dollar, as well as geopolitical reasons related to Iran
Earlier we defined exactly the end of the correction, the intermediate bottom at that moment was the area of 2300 and since that moment the price has overcome the way of 150 dollars or 6%. The bulls are back in the market and traders are ready to support the acutal trend.
It is worth paying attention to the support of 2431, 2417, it is possible the beginning of a small correction (assumed 4th wave), within which the price can test the above mentioned areas of liquidity before further growth.
Support levels: 2431, 2425, 2417
Resistance levels: 2450, 2475
The bulls will actively defend the nearest liquidity areas and strong support levels, as these are the risk areas for the buyer. The trend may get its continuation either after a pullback or when the price breaks through and consolidates above 2450
Regards R. Linda!

GOLD → Are the bulls ready to break through 2430 and go ↑ ? OANDA:XAUUSD on the background of weak dollar and favorable fundamental background realizes the accumulated potential after breaking through resistance. The price is testing the global resistance of 2431.
The market is bullish again, which was supported by economic news, mainly related to inflation.
Technically, the gold is again interested in strong buyers after the correction phase, which ended at the moment of the beginning of the realization of the bullish pattern, as well as the confirmation of the bulls. In general, this movement can be continued, as the general background is favorable for the gold market
In the coming week traders are interested in such news as:
- Powell's speech on Monday
- FOMC meeting minutes on Tuesday
- Initial Jobless Claims on Thursday
Resistance levels: 2417, 2431
Support levels: 2400, 2375
Technically, the price may test the ATH on Monday, but a bounce or a false breakdown may be formed afterwards, which will lead to a small correction. A quick retest of 2431 could lead to a breakout and further growth
Regards R. Linda!

Bitcoin is ready to reach a new all time high! (Buy now)Bitcoin finally revealed its direction and its bullish. On the chart we can see 2 parallel channels. The first one is currently breaking out and there is no doubt that the second parallel channel will break as well. Next resistance is exactly at the top of the first parallel channel, I am expecting a pullback from this strong dynamic line.
From the Elliott Wave perspective, the WXYXZ corrective pattern is now confirmed, so this is also a very bullish sign for the next weeks and months! On the 1h chart I can spot a strong buying activity from whales, so this also adds to my bullish bias. When new all time-high? And what is the ultimate target for this bull run in 2024/2025? I will reveal my strong technical analysis in the next post, so make sure you follow my account!
Right now it's strongly recommended to trade with the bullish trend, that means only long strategies and do not short Bitcoin on the futures market. This will increase the probability of success for your trades. I am bullish as all bearish scenarios were invalidated.

Bitcoin - Life time opportunity, buy now, new ATH soon!Bitcoin is forming this bullish flag pattern on the daily chart, and we have a lifetime opportunity to buy Bitcoin at the bottom of the flag. What's more, we have a long-term trendline starting in October 2023, which is another reason to buy Bitcoin in confluence with multiple technical indicators. A lot of people are calling for Bitcoin winter, but I don't think so. I see the recent price action as a great buying opportunity on the other side.
It is always important to do an Elliott Wave technical analysis to see the full picture. From my point of view, Bitcoin has formed and completed the WXYXZ triple-three corrective pattern inside this bullish flag. What you want to do as a trader is trade a breakout above the flag or buy at the bottom of the flag, potentially trading a breakout of the last Z wave.
Another reason why I think Bitcoin is bottoming out is the chart of Ethereum. This is probably one of the best indicators for Bitcoin, so we cannot miss doing analysis on it. You can check out my analysis of ETH in one of my previous posts, but I can tell you now that the crash was pretty strong (more than 30%) and we are in a bull market, so we definitely want to buy the DIP and prepare for another huge wave to the upside.
Let me know what you think about my analysis in the comment section, and please hit boost and follow for more ideas. Trading is not hard if you have a good coach! Thank you, and I wish you successful trades.

Bitcoin - new ATH soon. Best time to buy nowBitcoin looks very strong at this moment. We can see that the price is breaking out of the descending parallel channel on the daily chart. The price is above the channel and has already retested the downward-sloping trendline. We should see a strong pump from the current price.
Why is bitcoin pumping? From a technical perspective, it's pretty easy to say. Take a look at the previous price action. We have a false breakout below the key levels; it was a bear trap created by market makers to get as much liquidity as possible for their huge orders, as they cannot simply do so whenever they want.
From the Elliott Wave perspective, there is nothing bearish at this moment. I see that the corrective pattern WXYXZ has been completed, and we are starting a brand new impulse wave to the upside. The next target is around 71k because we have his important red trendline, so make sure you are aware of it.
Let me know what you think about my analysis, and please hit boost and follow for more ideas. Trading is not hard if you have a good coach! Thank you, and I wish you successful trades.

GOLD - Buy after this pullback!Gold is extremely bullish and is expected to double its value in the next few years. We want to take advantage of this bull market and implement long-only strategies on futures. Right now, GOLD is breaking out of the descending channel, but I want to see a retest of it. The price broke out of this channel but created a fair value GAP. These GAPs tend to be filled sooner or later, so do not FOMO in and wait for a proper retest. Then we can open a leveraged trade with a high probability of success and a high risk-to-reward ratio.
From the Elliott Wave perspective, we have finished the WXYXZ corrective pattern, which is also great to see! We are starting a brand new impulse wave to the upside, so prepare your limit orders. It's time to buy gold again.
The next significant resistance is the previous ATH. I do not really see anything special that is worth mentioning. Take only the best opportunities with a high success rate.
Let me know what you think about my analysis, and please hit boost and follow for more ideas. Trading is not hard if you have a good coach! Thank you, and I wish you successful trades.

GOLD → Consolidation above 2380 will cause a rise to 2400FX:XAUUSD is consolidating above the important for the market level of 2378. Bulls are trying to keep the defense above this zone in order to continue growth on the background of weak dollar.
Gold is recovering after leaving the correction channel. The price is once again near its highs (ATH), within the current move the price could quite possibly renew it if the fundamental background does not change next week.
At the moment, the main objective of the bulls is to consolidate above 2378-2385 in order to go higher: to 2400 and then to 2430-2450.
Support levels: 2378, 2371
Resistance levels: 2400, 2418
Within the current trend we may see a continuation of the trend. There is no strong news on Friday, so the movements may be calm. I am waiting for the resumption of growth from 2378, or from the channel support.
Regards R. Linda!

BITCOIN → Why did it drop to 60K? When do we expect 75K?BINANCE:BTCUSDT has been showing bullish prospects all week and has been consolidating above key zones, preparing to go higher, but on Friday the market changed to bearish and there is a reason for that.
BTC lost 3.3% on Friday and is currently painting a bearish picture. There are two reasons for this:
Inflation related news, basically proving that inflation is still high at 3.3-3.5%
Expiration of contracts for 1.15 billion. Put / Call ratio amounted to 0.64. Maximum pain point at the 62000 level. Liquidation of huge volume and consequently bearish momentum.
Technically, everyone is interested in one important question - when will the correction end?
Bitcoin continues to consolidate and collect liquidity at the expense of buyers. The market can test the key zones: 59300, 56500 and even there is a probability of testing 52900. But, the growth needs reasons and traders are still in the waiting phase.
The confirmation of the end of the correction, at the moment, will be the breakthrough of 64500-67500 and price consolidation above these zones. In this case, the global sentiment will change to a strong bullish one
Resistance levels: 61500, 64500, 67250
Support levels: 59300, 56500
Consolidation continues and at the moment the price is heading towards support. A false breakdown of one of these areas is possible before further growth.
Regards R. Linda!

USDCAD → Weak dollar. Currency pair in the correction phase FX:USDCAD is declining on the back of a weak dollar index and breaking the support of the descending triangle, which generally allows bears to dominate the market. The price may go down to 0.355
The uptrend is not broken, a correction is forming after a retest of resistance. A descending triangle is forming on the chart as the dollar index is starting to show weakness related to the fundamentals. Most likely, from 1.36328 the price may head towards the trend support from which a rebound may follow with high probability.
Resistance levels: 1.36328, 1.37
Support levels: 1.3547
I expect the bearish momentum to continue as the sellers are strong at the moment. The global trend is not broken, the market is developing a correction phase.
Regards R. Linda!

GOLD → Will the bullish sentiment persist after the news?FX:XAUUSD is growing and testing local descending resistance. Growth is associated with the decline in the dollar index on the background of Powell's comments. Ahead of the news on inflation...
Technically, on H4 the price overcomes the correction phase and returns to the bullish rut, testing the local maximum. Bulls are focused on consolidation above 2350. If this can be done on the background of the news, 2400-2500 is ahead.
Traders are waiting for the inflation report, which may be ambiguous like PPI. A slight weakening of the situation may weaken the dollar, and gold will react appropriately.
Resistance levels: 2378, 2400, 2418
Support levels: 2352, 2336, 2328
The mood of traders is bullish, which can generally determine the medium-term outlook for us. But inflation can both strengthen this bullish mood and weaken it. Trade carefully!
Regards R. Linda!

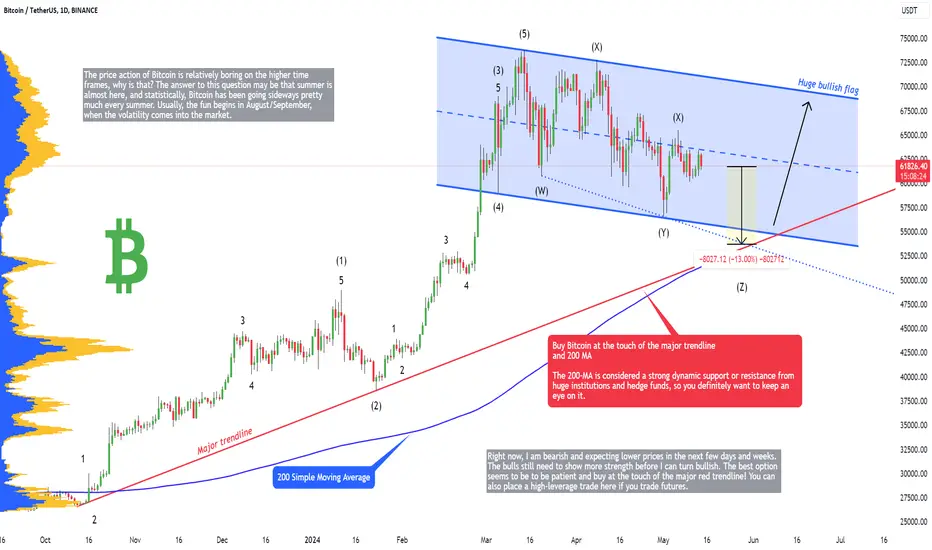
Bitcoin - Ultimate bottom will be here, but now 13% crash!The price action of Bitcoin is relatively boring on the higher time frames, why is that? The answer to this question may be that summer is almost here, and statistically, Bitcoin has been going sideways pretty much every summer. Usually, the fun begins in August/September, when the volatility comes into the market.
What can we expect from Bitcoin in the following weeks? I am expecting a 13% crash because we need to hit the major red trendline on the daily chart. This trendline should hold the price of Bitcoin to the end of the bull market, so you want to buy every touch of it! We also have a 200-daily moving average that is currently pretty much at the same price as the mentioned trendline. The 200-MA is considered a strong dynamic support or resistance from huge institutions and hedge funds, so you definitely want to keep an eye on it.
The price of Bitcoin is inside the bullish flag pattern, as you can see on the chart. This is a pretty strong confluence with the trendline to buy cheaper Bitcoin. Right now, I am bearish and expecting lower prices in the next few days and weeks. The bulls still need to show more strength before I can turn bullish. The best option seems to be to be patient and buy at the touch of the major red trendline! You can also place a high-leverage trade here if you trade futures.
Let me know what you think about my analysis in the comment section, and please hit boost and follow for more ideas. Trading is not hard if you have a good coach! Thank you, and I wish you successful trades.
GOLD → How can the price react to the NEWS on inflation?FX:XAUUSD earlier returned to the range after a false breakdown of resistance. The market is now fading as it is in the waiting phase for Powell's speech as well as the rest of the inflation news.
Traders are waiting for PPI ( ECONOMICS:USPPIMM ) today as well as tomorrow's CPI ( ECONOMICS:USIRYY ) . Earlier, the market discussed the interest rate cut as well as inflation, which continues to remain at a rather high level, which does not please the Fed. Traders are expecting inflation to drop from 3.5 to 3.4. This is possible, but it is still very high relative to what Powell, who will also speak today, is expecting.
Gold may react strongly to the news as economic factors are unpredictable. It will be necessary to follow the actual data and not to trade before the news.
Resistance levels: 2352, 2363, 2378
Support levels: 2328, 2306, 2295
Fundamentally it is still very bad, inflation is high, rate cuts are not expected, in general this scenario lays further strengthening of the dollar. In such a case, gold may continue to correct to the lows.
Regards R. Linda!

EURUSD → Retest of downtrend resistance amid weak $FX:EURUSD is heading towards trend resistance with interest. This is also supported by the weak dollar, which is standing still. But, the currency pair is still in a bearish trend
Buyers are trying to strengthen the euro. On D1 a consolidation format of movement is formed. In this case, the pair may test the trend resistance, but it will be difficult to break it the first time, because the dollar will continue to rise in price for some time due to the actions of regulators, which will affect the euro.
Resistance levels: 1.0802, 1.0864
Support levels: 1.0736, 1.0703
At the moment there is a probability of a retest of the resistance area, but the bears can give strong resistance to the buyers' interests, which in general can be reflected as a pullback from the upper boundary of the trend.
Regards R. Linda!

GOLD → Price moves back into range. Waiting for a test of 2328FX:XAUUSD returns to the range after a false breakdown of the liquidity zone. A strong sell-off phase is forming and price is heading towards a key support and liquidity area.
On local timeframes, reversal patterns cause price to test downside resistance and confirm its presence. False breakout provokes sell-offs towards 2328, this area is key for traders. The market maker is interested in a retest of the liquidity zone, relative to which a false breakout and growth towards range resistance can take place. In general, the market is still neutral-negative in the local perspective, accordingly, it is acceptable to consider both buying and selling intraday.
Resistance levels: 2352, 2378
Support levels: 2328, 2306
The correction will end only after breaking through the descending resistance (area 2365-2370), but at the moment the market is still in the correction phase, which is developing within the 4 wave.
Regards R. Linda!
