ZILLIQA : Interesting trends for daily updateHello trading friends,
This is an update for ZILUSDT depending on daily trends.
0,46+ is an interesting point for Zilliqa to watch out for the increasing trend with the time frame.
Zilliqa shows depending on TA trend interesting trends - and it's possible that we can see coming time a new volume trend - this depend also on the main coin BTC - what should stay at last stable.
Zilliqa could have a 25%+ increase by green trend.
Further, it's important to check also BTC trend - and to manage risk in case Zilliqa did choose another side.
Trend increase can take time - as market going on their way.
Have a great day.
@ This is not a trading call - trade always depending on your setups.
Zil

ZILUSDTHello Crypto Lovers,
Mars Signals team wishes you high profits.
We are in the daily time frame. The price has had a positive diversion shown by the white line. After being supported at the support zone, the price moved up to the first resistance zone. Now we expect the price to break the first resistance zone and after a pullback, move up to the next resistance zone. If it is not able to break it, it will move down to the support zone. We expect the price to range in-between the support zone and the first resistance zone and then move up to the next resistance zone.
Warning: This is just a suggestion and we do not guarantee profits. We advise you to analyze the chart before opening any positions.
Wish you luck

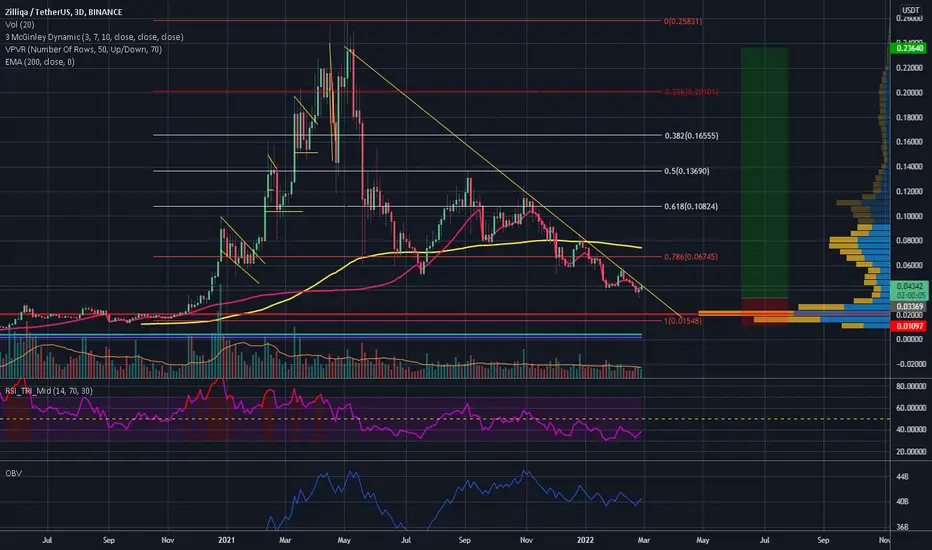
ZIL almost in a perfect accumulation zoneI expect BTC to go down taking the market with it and when this happens (I suppose very soon) ZIL should follow. However I can't miss the fact that ZIL price is very far from its ATH and almost to the 1 Fib line and a potential growth of 600% with little to risk.
My advice is to wait for the next market drop, check where ZIL bottoms and at that point I'd start accumulate up until ZIL doesn't cross EMA 200 upwards. I think this could be a trade with a good profit potential. Moreover the project it's solid.
Recap: don't enter now, check how far does retraces, maybe set some alerts and then start accumulating until ZIL crosses EMA 200. Easy!
Good luck
ZILZIL give H&S breakout and is at resistance line, can buy this coin in two parts (now and correction). Breakout can be big if BTC continue trend.

Zilliqa Reaction To The Current MarketZilliqa has been bouncing on .618 Fib zone after a long while and now its retesting that level once again. Depending on Bitcoin move and the break of 200 SMA, we might see more upside for Zilliqa.

ZILUSDTHello Crypto Lovers,
Mars Signals team wishes you high profits.
We are in the daily time frame. The price has broken the S1 line which was previously the resistance. The price can make a pullback to the S1 line and then go up. Or it can go up straight from here. You can buy half of it here and keep the other half at the S1 line in case the price comes down. R1 and R2 areas are good places to save profit.
Warning: This is just a suggestion and we do not guarantee profits. We advise you to analyze the chart before opening any positions.
Wish you luck

Can ZIL break the resistance in JUNE 2022?There is a resistance line for ZIL, if the market is going to recover after this spring, can we see ZIL break the resistance in June as well?
If anything wrong happens and the volume starts to come in, I don't see why not.

5 Key Levels of Resistance for $ZIL These are my 5 key levels to break for Zilliqa to clear the path to new all time highs.
1. Downtrend since Nov. 10th
2. High liquidity zone of resistance
3. Downtrend since Sept. 5th
4. Psychological resistance of $.10 ($.096)
5. High made in Sept. Horizontal Resistance.

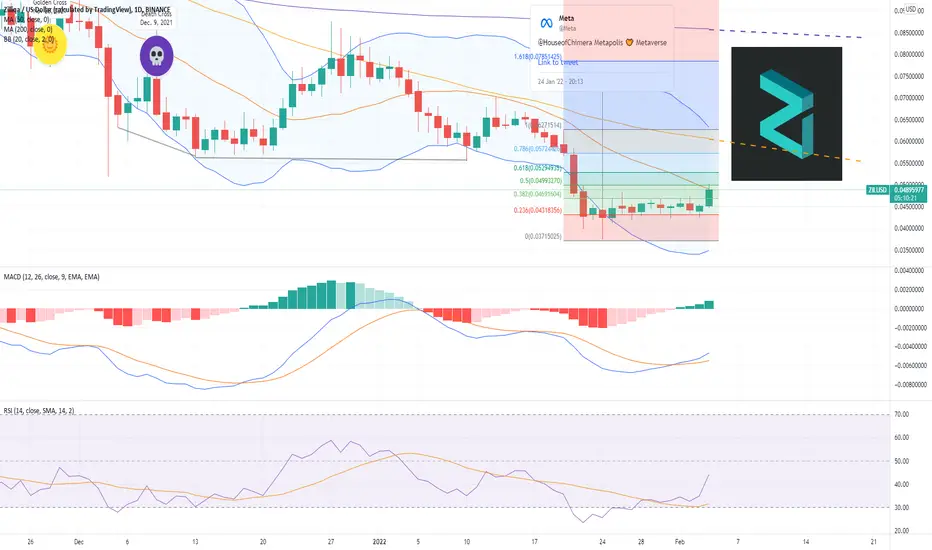
Zilliqa ($ZIL) DTF$ZIL Big Wick Energy meets $0.0499 FIB resistance with amazing buying pressure. We need to attack the $0.0572 FIB level with a close and confirm to keep the BULL-mentum going
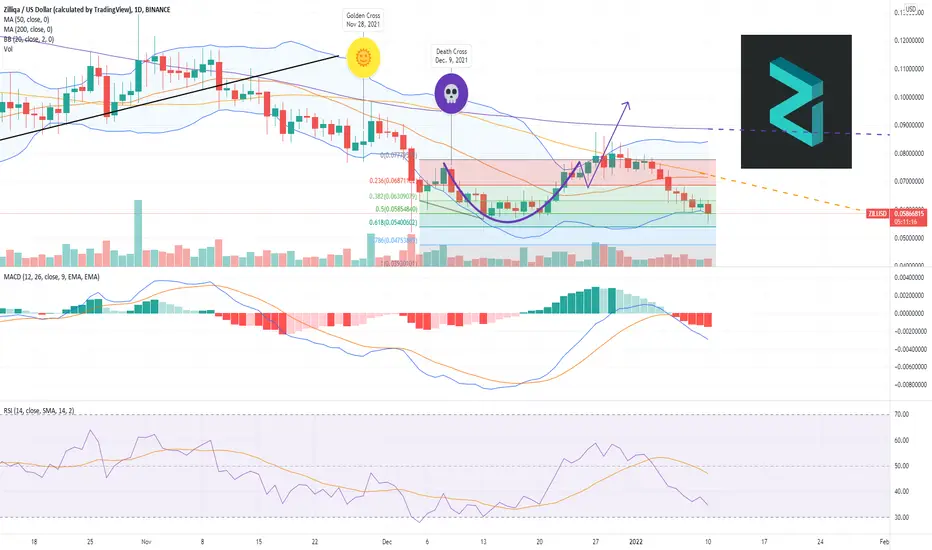
Zilliqa ($ZIL) DTF FIB$ZIL DTF continues to chop between $0.043 FIB support and $0.0469 FIB resistance. $ZIL has a long of work to do but I am adamant that the best is yet to come. Let's touch that 50MA!

Awaiting reversalseems like correction coming to its end
maybe one more dip is left. just an idea :_)

$ZIL long term prediction$ZIL have lot of potential, in technical and fundamental. i think it will be good to hold for next few months
Trade responsibly
Invest responsibly


ZIL USDT double bottomSimilar to BAT chart I posted recently, but this one didn't break above the resistance trendline yet. Indicators high so watch for pull-back or retest entry. Support is tested more times in the past so we may assume that this will be bottom. (If king do not throw some more s..t at us by dumping more). Set alarms. Good luck traders

Accumulate: ZilliqaChart Pattern: Cup and handle formation
Strategy: BTFD + Stake (accumulation/waiting game)
Catalyst(s): Release of Metapolis this Q1 202 | L1 storyline

Zilliqa (ZIL) can start a big reversal from triangle's supportHi dear friends, hope you are well and welcome to the new update on Zilliqa (ZIL).
Channel and a triangle:
On a daily time frame, Zilliqa had a fake-out from a down channel and formed a symmetrical triangle above the resistance of this channel. Finally, priceline broke down the support of the triangle and re-entered the channel again. Now we have strong support at $0.053. Therefore, there is a possibility that this time the price action will not test the support of the channel.
Huge triangle and SMA support:
On a weekly time frame Zilliqa has formed a descending triangle and it may test the support of this triangle once again. Right now it is very close to the support. There is also 200 simple moving average support below the support of this huge triangle. Therefore, the price reversal is very much possible.
Note: Above idea is for educational purpose only. It is advised to diversify and strictly follow the stop loss, and don't get stuck with trade

Zilliqa ($ZIL) FIBZilliqa ($ZIL) FIB: $ZIL continues to use BB LL as support whilst respecting $0.0585 FIB support. $ZIL, an incredible discount and now would be the easiest time to accumulate 1M $ZIL. You don't need to outright buy 1M $ZIL. You can buy a big bag and trade up to 1M $ZIL. Still within realm of reality

ADA weekly chart has a great opportunity.ADA weekly chart...this company has been some what
of a disappointment to many investors and traders...
but there are some great opportunities right now on this chart.
there is a bear pennant on the chart and a lower low on the RSI...but
that turns very Bullish once it turns around...so at the moment, its
screaming opportunity lurking at each investor. remember this
Cardano isn't the fastest developer but they do things correctly
and will be around for many years to come.

ZIL WEEKLY CHART HAS HIDDEN BULLISH DIVERGENCEZIL weekly chart. This chart is looking bullish. price targets
listed in the blue. This chart formed a nice bull pennant and
with how the RSI has a lower low, this has HIDDEN BULLISH DIVERGENCE.


Zilliqa ($ZIL) FIB and $0.085 TargetZilliqa ($ZIL): $ZIL still holding tightly to $0.07729 FIB resistance and 50MA. The BULL battle is not lost as long as the MACD trends above the signal line and the RSI keep above 50.
What's next for $ZIL to hit $0.085? I would like to see:
1-Close above 50MA and $0.0772 FIB resistance
2-Confirm close above 50MA and $0.0772 FIB
3-50MA crosses over 200MA
4-Close above golden cross 50MA
5-Confirm close above golden cross 50MA
6-Touch upper BB at $0.085

Are you ZIL holding? ZIL is currently testing a long-term resistance (black line) on the daily chart. There have been multiple parallel channels in its journey so far. If ZIL breaks the trend line with a strong momentum candle the idea is that it will continue to trade in the upward channel. Until that happens ZIL can see a short-term fall to the green support which may be a good entry point.
Please note I am not a financial advisor and this is not financial advice, all ideas are for educational purposes only :)
Please DYOR and enjoy the idea!
