Zil
Zilliqa Higher High are ComingIf Bitcoin breaks over 10k I expect Zilliqa to follow and looking at past resistance as profit zone to valuated if were going to have another Altcoin season.
ZIL/BTC - First target DONE!i am very happy to see a large volume and will keep my long position .... hope be better :)
Analysts Think the Worst is Yet to Come for AltcoinsThe aggregated crypto market hasn’t been able to capture the full momentum that Bitcoin has experienced in recent times. The flood of funding to Bitcoin suggests that investors are keen on being exposed to the potential upside offered by its growing status as a “hard asset.”
The benchmark cryptocurrency’s overt strength comes as it is flashing immense signs of bullishness against a bleak global backdrop.
Its popularity amongst traditional investors has grown greatly as well, as prominent Wall Street investors like Paul Tudor Jones have offered bullish outlooks on BTC.
All this has caused its dominance over the aggregated market to rise, with many altcoins seeing woeful performance against their BTC trading pairs.
This has led one analyst to note that a bout of capitulation could be imminent for these smaller digital assets.
Bitcoin’s dominance over the crypto market has been growing ever since the early-2020 uptrend began stalling in mid-February.
At this point, BTC’s dominance over the market was resting at roughly 60%, with the turbulence seen in the months following eventually leading it to yearly highs of 68% just last week.
This suggests that investors are fleeing what are perceivably higher-risk assets in favor for the benchmark cryptocurrency. Its global media attention stemming from comments from Paul Tudor Jones and others may also be playing a role in this trend.
Today, virtually all of the top 20 altcoins by market capitalization are trading down against their BTC trading pairs.
A similar trend has been seen throughout the past couple of weeks, as its recent push towards $10,000 has likely been driven by investors siphoning funds away from altcoins.
Altcoins May Soon Capitulate, Paving the Road for the Next “Altseason”
The long-awaited “altseason” has led to massive disappointment amongst investors, as many smaller cryptocurrencies are trading at multi-year lows against Bitcoin.
One pseudonymous crypto trader spoke about this in a recent tweet, explaining that he believes many altcoins will soon see capitulation.
He also notes that this could provide investors with “huge oppurtunities.”
“ETH heading for levels not seen since 2016. LTC trading below 2014-2016 prices. XRP heading for levels from 2014, 2016, and 2017. The alt market looks like it could capitulate soon. Seems like the worst is yet to come but afterwards should provide huge opportunities,” he explained.
Another trader echoed this sentiment, noting that he believes Bitcoin continuing to push higher as altcoins decline could provide the perfect conditions for “altseason.”
“I hope BTC keeps mooning while ALTS capitulate in the next few months because that would be the perfect conditions for altseason.”
WRX WILL FOLLOW ZIL TO GO TO THE MOON NOW#WRX/USDT:
ENTRY: 0.1350-0.1365
STOPLOSS: 3-4%
TARGET: 1500
is ZIL going up?Will this triangle playout in the upside? Its been a while #zil. green cloud finds it hard to form..
$ZIL on a weekly chartA ramp-up back to 0.00838 will not be rocket science given what #Zilliqa has achieved this week. #LunarCrush social mentions, #SocialPay for increasing social recognition, adoption, and $ZIL use-case expansion.
Zilliqa Gains Momentum... Additional Targets (95% Total)Just 5 days ago we shared a chart for Zilliqa (ZILBTC) with a 50% target... This target is very close now.
On this updated chart, we would like to share additional targets for your convenience.
ENJOY THE PROFITS.
Namaste.
----
Previous chart
May 1 | Zilliqa Breaking Out Of Bearish Pattern (Easy 50% Mapped)
This is not financial advice.
$ZIL in the eyes of $DGB on a weekly chartGiven that volume on $ZIL is 30x that of $DGB: #HUMONGOUS!
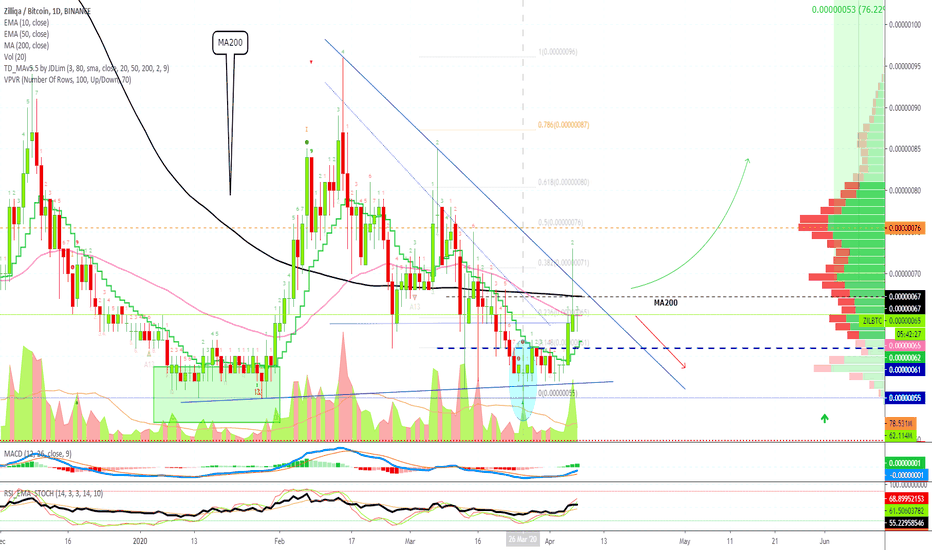
Zilliqa Challenges MA200, Starts To Look Good!Zilliqa (ZILBTC) has been great to us in the past with great profits... It's been a while since we last traded this pair.
Now, after a long period of consolidation, while Bitcoin prints strong swings down and up, ZILBTC is getting ready for a strong bullish jump.
Zilliqa Chart Analysis & Signals
Prices are now trading above EMA10 and we also have increasing volume.
A clear reversal signal can be seen 26-March... And now prices are moving up.
MA200 is the next major resistance that needs to be broken in order for prices to gain momentum while continuing higher.
ZILBTC is now facing EMA50 at 65 satoshis (0.00000065). With yesterday's long-wick, this level is soon likely to break.
This is it for this analysis.
Thanks a lot for reading.
Namaste.
Zilliqa Breaking Out Of Bearish Pattern (Easy 50% Mapped)Zilliqa (ZILBTC) is breaking out of a downtrend and is now aiming higher.
ZILBTC managed to move pass MA200 today while trading above EMA10/EMA50.
The trading volume is really going towards the bulls and we have bullish indicators, the RSI looks especially good.
ZILBTC can produce an impulse move once the daily candle closes above MA200.
Always make sure to build/have a plan or strategy before you decide to trade.
Namaste.
$ZIL on the Weekly chart+1B volume and +50 RSI, a bullish week could see ZIL at 0.0083 in the coming week.
$ZIL, Crossed over ~64sats resistance level w/ increasing volume$ZIL
Crossed over ~64sats resistance level w/ increasing volume and now sitting over matching EMA50
UCTS Signaling a Buy signal on the daily & lower timeframes...
Looking for an entry at support level & looking for continuation toward ~76sats
#ZIL


