zilliqa has reached the bottom of the channel zilbtczilliqa has reached the bottom of the channel zilbtc
the movement of bitcoin was disrupted by the gradual growth of zilliqa, but I think that this is temporary and the closure of this weekly candle will show what will happen next ...
ZILBTC

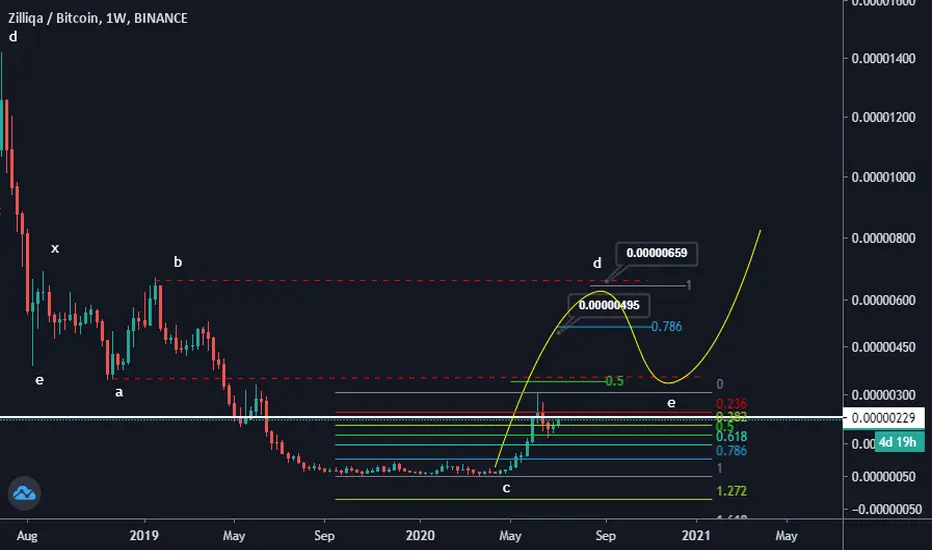
Inverted Cup and Handles. Hello Trader,
Waves are forming an inverted cup and handle pattern. It would be an excellent opportunity for a swing trade.
Please push like button and follow us on tradingview.

ZIL buy opportunityPlease feel free to comment or challenge me on my TA. If you like my idea, leave a like to show support.
--------------------------------------------------------------------
Following BITBAY:BTCUSD strong move last weekend many alts didn't survive the pressure. For certain quality projects, such as Zilliqa, this means a lovely buy-in opportunity.
- Fell straight through .5 FIB level
- .681 FIB level coincides with daily support @193 sats
- Hidden bullish divergence on the RSI
- RSI entering oversold area
Entry zone: yellow box between 129 & 140 sats
Target points: 167 - 193 - 214
Watch out for Bitcoin's movement. Set your stop losses tightly.
*Not financial advice*

ZIL-BTC Zil broke out from bull pennat 3days ago, now testing trendline from other side.
1d MACD soon to flip bullish, stoch at 31 also good.
Correction seems to finish soon.

Ziliqa Consolidating NicelyZILUSD is struggling with the 4-hour time-frame at the moment but from a 2-day and 3-day perspective things are looking very good indeed.
Price seems to have found good support around the 16 cent level to consolidate this months upwards price movement.
Our 40% target was delayed, but back in play.

ZIL/BTC Forming a nice bullish bowl / cup and handleZIL/BTC Forming a nice bullish bowl / cup and handle
Aggressive entry buying the bowl - higher risk.
Measure move is approximately 40%.
Just another idea, let's see what happens...
Cheers!


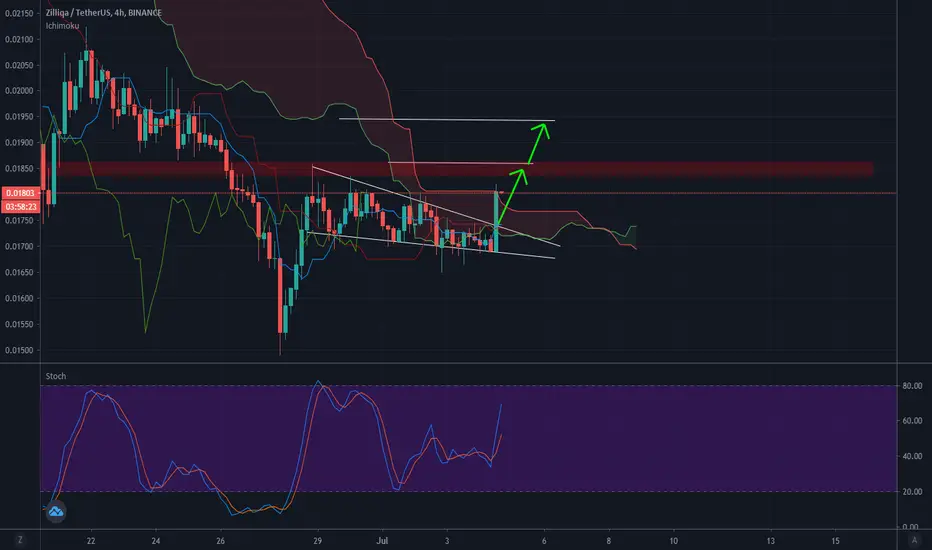
ZIL/BTC possible trend reversal at this point and going upThere is a trend in the 4H timeframe which has a strong resistance at the level the price is currently on. We might see an upward movement here. The stochastic and support line indicates the movement.

ZIL BTC ZIL BTC ready to reach 300 sats by 7/20 and then break it, if we look at chart the next target of ZIL BTC is about 550 satoshi which could take upto 3 months to playout. However, when train leaves the station, you never know how fast it can go.

ZIL/BTC daily outlook 7/12/2020Good morning everyone and welcome to my alt coin analysis. I have been getting a lot of requests so every time I feel like analyzing a coin I go to the list and pick the next one down. Right now it is ZIL/BTC. I see that so many alts look quite similar to this chart. Almost a year of flat sideways movement with almost nothing exciting occurring. That is until May of this year. We saw a 5X jump from nearly 60 sats to 310 sats. That is exciting and I congratulate anyone that had the foresight to buy at 60 sats... Your patience has been rewarded. We have dropped a bit since this years ATH of 310 sats. No sweat though right? Only time will tell us if the gains will hold.
I pointed out on the chart that this particular coin has been moving sideways and flat in some sort of huge accumulation period. It stayed around 60 sats for almost 1 full year before finally becoming bullish again. But if you look at the more zoomed out (weekly time frame) we are still very far from the previous ATH of nearly 2500 sats. So we are still very far from that. But that doesnt mean we cannot make some money off this alt.
I also pointed out that the daily has a full on golden cross. This golden cross sort of reminds me of the one we saw on the BTC/USD chart last year in May. We shot from 5500 to 14k in a matter of weeks after that golden cross. I say this often but not all golden crosses are created equal so you should understand that before you jump into a long on account of this analysis.
I also threw a traditional fib onto the chart to get an idea of where support and resistance could lie and it looks to me like we are testing the .382 fib (yellow fib line) pretty strongly. I have already received a sell signal for now so we may drop below this .382 fib if that sell signal was right. Only time will tell of course. We are still nearly 4X up from earlier this year so there would be no shame in taking some profit even after missing the ATH this year. Believe me, traders rarely sell at the top. Many claim they never miss the top but if you ask me I think its BS. If they were that good they would not need to work a 9-5 on top of trading. But then again WTFDIK???
TLDR: I like what Im seeing with Zil... Its nice to see life in this alt after some pretty solid consolidation that has finally come to a conclusion. If you want to go long at this point set a stop loss.... But that is a rule I always stick with. Good luck everyone!

UPDATE INDEX INDEX ONT ZIL TRX XLM MTL CMTONT 20%
ZIL 20%
TRX 15%
XLM 15%
MTL 15%
CMT 15%
update for the first and 2nd targets, time duration aprox. 1-3 weeks
please check previous stage
original entry was 1933
maintaining targets
3000
6000
10000
15000
20000
no trading advice

zilbtcgreat opportunity for buy in deep BINANCE:ZILBTC
targets marked in chart
don't forget about your SL
$ZIL, Reclaiming ~200 sats support level & pushing up$ZIL
Reclaiming ~200 sats support level & trying to keep pushing up...
UCTS turning green (Buy) on lower timeframes...
Still looking for increasing volume as full confirmation but aiming for an entry at support level w/ tight support looks OK..
~260 sats as 1st target..
#ZIL


Ziliqa at risk of 40% drop reveals new weekly candleThe weekly candle close was brutal.
After an indecision candle 2 weeks ago which pierced resistance and then closed below...
...then last weeks candle a steep red...
...and MACD trending down...
...given the meteoric rise we've seen in ZILUSD the past few months...
...it makes sense that Ziliqa may have to drop all the way down to find support, perhaps at the 0.011 level. A 40% drop from current price.
This is more likely to happen if BTCUSD does not somehow manage to quickly break it's consolidation range to move upwards, which as usual would probably bring the rest of the market up with it, including Zil.
Bottom line, traders are likely to be taking profit and looking for a cheaper entry position on Zil.

ZIL/USDT (Flip Old Resist>New Support?)ZIL/USDT
-after the trendline breakout
-the price has pullback to previous resistance
-and has the chance to flip into new support
-there is also a new upward trendline support
-aggressive buyers can enter the market at this area
-while breakout traders will wait for the resistance at the 1950s
-and enter a breakout confirmation
-the upside target is up to 2130-2600s


ZIL/BTC (Break Trendline Resistance?)ZIL/BTC
-touches to 50D MA twice and reacted bullish on it
-the 170 sat range is also an are of confluence support
-we can the price challenging the daily trendline resistance
-the more it get tested, the more it gets weaker
-you can enter the break/close of trendline
-have a stoploss below the 50D MA

ZIL reboundHe go up to top of the falling wedge (about 0.0299 $)
After break out the falling wedge and retest with pullback, he ready to go up until BTC go up.

Alligators Trend Following on ZILHello, Traders.
Our indicator is showing that we are still in a downward trend since the formation of the top, I believe that we can sideways between 180 satoshis to 220 satoshis, that is quite a volatility.
The buying point in this asset is when the price goes above the alligators moving averages, so the buy point is going to be on the pullback to the "lips" line
See in this example above what needs to happen in order to have a good buy, the price needs to be above the 3 lines of average movements and make a pullback to the green line, so we end an excellent trade with a good risk-reward.
Patience Pays.
Push the like Button and follow us on TradingView.

#ZIL/BTC (June 29)ZIL is having a strong support zone at 150-170sts, which can push ZIL back to the price above 200sts
In the short-term, ZIL can hit 2 zones : 220sts and 250sts
If ZIL falls out of 150sts, this uptrend of ZIL will end!

