ZIL/USDT (Trendline Resist Retest)ZIL/USDT
-a strong bounce from the 1490s or 20% move up
-testing the trendline resistance
-if we are looking for a bullish entry
-we want to see a break of the trendline
-comeback and retest to become new support
-that's a good Buy position and target the up to 2122-2666
-stoploss is placed under 1490
ZILBTC


ZILBTC 440% bullish move and a bullish reversal patternHi friends hope you are doing well and welcome to the new update on Zilliqa coin. Zilliqa has surged more than 440% and in today's article we will try to understand how this coin completed the setup before this bullish move and what the price action can do next?
A formation of big pennant:
A year ago on 21st June 2019 I posted a chart where I revealed that the price action of Zilliqa coin is moving within a pennant on weekly chart And it take a bullish divergence at any time. At that time the price action found the support at 0.00000200 sats. Froom May to June 2019 the price action moved above 0.00000200 sats support and again moved down at the support of the pennant. Since then it was moving with the support of pennant and finally found the last support at 0.00000055 sats.
The price action left the pennant directionless and moved sideways from September 2019 to April 2020. And finally took a powerful bullish divergence and produced more than 440% bullish rally. If we place the Fibonacci tool from the tail of the pennant up to the support of 0.00000055 sats then the sell targets would be as below:
1st target 0.382 Fibonacci projection at: 0.00000300
2nd target 0.50 Fibonacci projection at: 0.00000370
3rd target 0.618 Fibonacci projection at 0.00000440
4th target 0.786 Fibonacci projection at 0.00000540
The above is the projection tail of the pennant to the support of 0.0000055 sats.
The strong resistance:
After hitting the first target at 0.00000300 sats the price action also has found a strong resistance at this level. This 0.00000300 sats level is really very powerful resistance for the priceline as it has never been broken out since after it was broken down. We have seen several attempts by the price action from the May to June 2019 and after a long time the price action again has attempted to breakout this resistance and now it is rejected again.
The simple moving average resistance:
If we place the simple moving averages with the time period of 25, ,50 and 100 on this weekly chart. Then it can be also observed that the price action also has a strong resistance of 100 simple moving average on this long-term weekly chart. And the 25 and 50 simple moving averages are below the price action but the distance between the candlesticks and these moving averages is very big. Therefore if the priceline will be moved down to have some support by these moving averages then there can be a drastic drop of around 100%. Because at this time the 25 simple moving average is at 0.0000097 sats. However if the moving averages will be moved up to provide the support to the candlesticks then the price action will not take a big drop.
A bullish reversal pattern on small time period chart:
Now if we switch to this small chart with the time period of 2 hour. Then we can notice that priceline is continuously forming different harmonic patterns. First the priceline formed a bullish Cypher pattern (Here I have ignored a small difference of C leg) and after taking bullish divergence from the potential reversal zone of Cypher the priceline also formed another bullish BAT. At this time price action of Zilliqa is moving in the potential reversal zone. This potential reversal zone should be used as stop loss because if the priceline will break down this potential reversal zone level. Then it can move more down to complete the final leg of bullish Butterfly pattern. Even though these harmonic moves are not formed on as that much big time period chart that can provide a strong push to the priceline to breakout the 0.00000300 sats resistance but how ever it can be helpful for the priceline of Zilliqa.
Conclusion:
After taking the first bullish move this is first time the price action has started a correction rally. Therefore this drop was required for the healthy bullish move. Therefore we cannot consider it as a big drop unless it will not cross down the 0.786 retracement level.

Shill the ZilPlease feel free to comment or challenge me on my TA. If you like my idea, please leave a like to show support.
--------------------------------------------------------------------
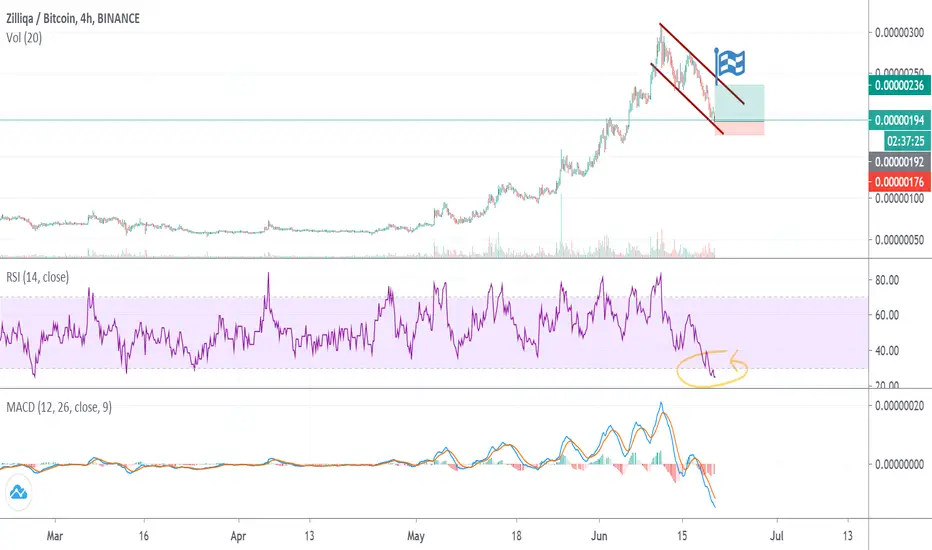
Zilliqa has seen a very nice bullrun over the past month. It played out beautifully with retracements whenever it was necessary.
After a 300% increase since the beginning of May it is healthy to see a significant correction come into play. Zilliqa however is a qualitative project with great upside potential. This is why I feel this correction is welcome as it gives us the opportunity to either buy some more ZIL at a cheap price, or to catch a nice trade with high R/R.
What can the chart tell the bulls :
- Elliot wave correction has been fullfilled
- Higher lows have been set (yellow circles)
- Double bottom formation
What can the chart tell the bears :
- Yet to set a higher high
- Bearish divergence with the RSI
- Weekly resistance level at 214 sats
Trade opportunity:
Possible entries: Weekly R (214 sats) or Daily S (206 sats)
Targets: Daily R (229 sats) = 7% and Weekly R (286 sats) = 33%
Happy trading!

ZIL/USDT (Potential Break of Trendline Resist)ZIL/USDT
-challenging the trendline resistance
-there is also a local resist at 2070
-new potential higher low is being established at 1900
-holding strong a previous resistance > new support
-good buy signal is the price break/close above the 2070s
-upside target is up to 2620s
-stoploss is placed under the 1900s

Zilliqa Short Time Review (Zil Btc)If it can break the trend line from 230 satoshi, 270 satoshi is not far away. if it fails, it can try the bottom trend line and come to165 satoshi. It is my amateur work. it is not investment advice. good luck.

ZIL is in great opportunityZIL could be inside this channel. RSI is oversold and the price is on the support. I bought in 192 satoshi. The target is on upper trendline . Dont fortget to end your position, we are in the downtrend.

ZIL ZIL could be inside this channel. RSI is oversold and the price is on the support. I bought in 192 satoshi. The target is on upper trendline. Dont fortget to end your position, we are in the downtrend.

ZIL BTC | Trend Reversal | Flow | Key Fibonacci LevelsTodays analysis – ZILBTC – trading in a possible descending channel, currently testing local support.
Points to consider:
- Flow in the market/price action
- Respecting key Fibonacci levels
- Resistance Confluence
- Trend Reversal
- Low Volume
- RSI below 50
ZILBTCs healthy counter-trend and strong continuation adds legitimacy to the money flow.
The previous swing-low respecting .618 Fibonacci retracement is indicative of a current retrace to .618 Fibonacci level.
The .618 Fibonacci level also coincides with descending channel resistance. A rejection at this level will solidify a trend reversal with a lower swing high.
An increase in volume is necessary to add legitimacy in the overall market.
RSI attempting to recover from oversold conditions. A countertrend will neutralise and prime the oscillator for a trend continuation.
Overall, in my opinion, a short trade is validated at the rejection of the resistance confluence with a technical target of local support.
Entering the trade at resistance confluence consents immediate trade invalidation (price trading beyond resistance zone), mitigating overall risk.
What are your thoughts? Let me know in the comments below!
Be sure to leave a like and follow me for daily chart updates.
As always, focus on you - and the money will too!

☆ ZIL / USD — Zilliqa In Danger, Here is WHY ☆Hey guys! here is the Zilliqa price prediction and analysis for upcoming moves.
I hope you will be safe and you control your risks in your trading.
This is explanation how to use Livermore's Cylinder in trading and market analysis.
Previous winning Livermore analysis by me:
BTC:
CAD:
CAD:
Stay tuned to
Artem Crypto

Long on ZILAs the market starts to align for a strong push upwards we start checking on the usual coins with great buildup to recover.
The scenario as I see it is a push towards to 650 followed by a retrace in the 500 zone and blasting all the way to 1200 at least.
No trading advice.

ZIL/BTC Breakout to 180+ SatsZIL Breakout to 180+ sats after 155 is breached. Easy 30% move incoming

ZIL/BTC (Potential Lower High?)ZIL/BTC
-please examine the chart
-both trade setup is already posted
-always apply risk management
-thank you, happy trading


ZIL / BTC Bullish Trade IdeaZilliqa is trying to break above that falling wedge pattern. Set your alerts to the upper trendline of the falling wedge and if breaks out with confirmed volume you can let it ride for more room.


ZIL/USDT (Bounce Reversal?)ZIL/USDT
-the price bounces off at my previous analysis
-before it happened, it painted a bullish reversal candle
-currently trading outside the trendline resistance
-if this break continues, the minimum target is up to 2677 or higher
-stoploss should be placed under 2137s

ZILLIQA ($ZILUSDT) 💹 | Zooming into Zil for the Double Kill?🏁On our last ZIL chart, we illustrated how ZIL was coming up to heavy resistance on higher time frames and only has a handful of key support ranges below.
What the bulls need to do to maintain momentum in the current uptrend is to find support ASAP and quickly head higher. Failing to do this isn't the end, it just really dampens the immediate bull case, which means fewer eyes on ZIL and buyers, which likely leads to more downside rather than the strength needed to break the resistance above.
Since this is true, and since our last ZIL chart was a broader high time frame overview, today we'll zoom in a bit to look at logical places for the bulls to find support.
Our analysis today is brought to you by user request, don't forget to ask questions and request charts in the comments below.
Support:
The pattern so far has been shallow pullbacks full of higher lows and clearly bullish price structure. This current correction is already looking a little bit more like a top due to a deeper pullback and the retest of the previous range (this is a first since the uptrend gained momentum).
With that in mind, the S1 bullish S/R flip and orderblock cluster is the most logical place to find support if the overall uptrend is to continue. We may have lost a little bit of bullish price structure, but a move up at S1 retains a structure of higher lows at least.
If S1 can't hold, then a retest of the S2 S/R flip also generally retains the overall bullish structure. Accumulation between S1 and S2 before moving higher, has some logic to it, especially on a higher time frame where we would be finding consolidation ontop of an important range from the first half of 2019 (see related ideas for our higher time frame ZIL chart).
At S3 things start looking grim for the bulls. Breaking below S2 means momentum is lost and clearly bullish market structure is too. It isn't like S3 or even S4 can't act as support and eventually result in a move higher, but it is likely that the excitement and the bullish narrative gets lost with a retest of these levels.
If we do end up going down below S3, we suggest looking to our longer-term ZIL outlook in the related ideas below.
Resistance:
In terms of local support and resistance, there is only one level to contend with, that is the R1 bearish S/R flip. If bulls can break above R1, we are likely going to run unless the broader market pulls back with enough intensity to stop alts from running.
Summary:
The bulls will want to S1 or S2 hold and then R1 broken quickly. The longer ZIL corrects, and the deeper it corrects, the more momentum is lost.
While there is a bit of good news like Binance staking to help hold up price, momentum and bullish structure is the main thing ZIL has going for it, so bulls want to focus on retaining that above all else.
Resources:
twitter.com
Hit that 👍 button to show support for the content and help us grow 🐣

ZIL/USDT (Key Support>Bounce Up?)ZIL/USDT
-approaching the previous area of support
-if the RSI hits near oversold level here
-there is a chance we may see a reaction bounce
-watch closely this area / add your alerts
-look for a sign of reversal before entering

ZILLIQA 👁️🗨️| How Zilliqa Can Help The 9th Season Of GOT🔞Zil has made a mind-blowing 1,200% run since the COVID bottom, despite being in a longterm downtrend before that. While the trend still good, ZIL is coming into a heavy amount of resistance.
Will the bulls keep this momentum going, or is ZIL ultimately headed back down? Let's take a look at some levels to see what both the bulls and bears are up against.
Support:
As you a see, there aren't a ton of support levels showing on the chart. This is because the velocity of the most recent move has made it so we can only detect some key levels on lower time frames.
Within the first range on the chart, there are notable support. Even though its levels can't be seen here, this is the ideal place for bulls to find support if there is a pullback.
The S1 S/R flip and the S2 S/R and orderblock both give the bulls a chance to revisit lows if we do head down there, although the trend will be pretty dismal at that point. Meanwhile, at the bottom, we have one last bullish S/R flip that may act as a support of last resort at S3.
Resistance:
The bulls have a lot of resistance to contend with above. First up Is the R1 bearish S/R flip and orderblock cluster, after is the R2 S/R flip. These both come from the range formed in 2018 before the big drop. It'll be important for the bulls to make it up here and find support (without fully breaking momentum) if they want to contend with higher levels.
Our next resistance after is the swing high of that aforementioned move at R3.
Above R3 is the R4 orderblock that was formed on the way down during the immense downside move.
Continuing up we have the R5 orderblock + S/R flip cluster.
Again, these two come from a range made on the way down in 2018.
At R6 we have an orderblock near the range highs of the noted range.
Next, we have R7 which is an S/R flip that seen heavy respect as price attempted to swing up.
Lastly, we have the R8 and R9 bearish orderblock which are the last points of resistance for the bulls before making all-time-highs; an unlikely, but possible, event.
Summary:
The bulls need serious momentum to keep going, but the longer it goes the more overextended the move becomes.
Support will need to be found eventually, but stopping to find support means losing momentum, which may be worse than becoming overextended.
Bulls are playing a dangerous game, but this trend is jaw-dropping and so are the returns so far.
Resources: twitter.com
✨Drop a comment asking for an update, we do NEW setups every day! ✨
Like, Comment & Follow to help the community grow 🎉🎉

$ZIl, Over 300% & about to reach ~300 sats $ZIl
Over 300% & about to reach ~300 sats
Price per #ZIL on May 1st was 60sats...
