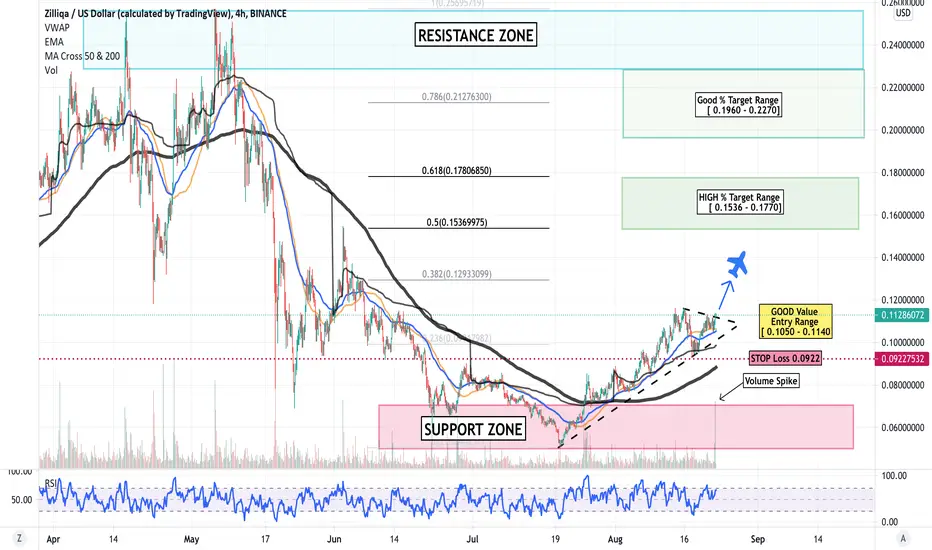
[ZIL] Zilliqa - BULLISH. About to pop with volume spike!ZIL is on the way up with a valume spike. A very nice trade set up currently
Zilliqa
ZIL with targetForgot to post the last cup and handle pattern, and it arrived at the pattern's cup price target. Rejected on resistance, now making antoher pattern with the target of 0.13 $ have a look and tell me what you think

Fib Speed Fan and a line in the sand #Zilliqa $5.25 ?The fib speed fan I suppose is as good as any for possible forecast scenarios, especially in Price Discovery and over Time. So the line in the sand is end of December 2021, but could be later or the bull run fails or extends. Its all Crystal Ball stuff, any body who tells you otherwise is lying. That said looking at crucial lows on the fan chart and general trends its not to bad as a tool for imagining where price may go over time.

is ZIL gonna Reach 0.12$?probably!Hi every one
ZILLIQA / TETHERUS
ZIL/USDT has started to Range in a Broadening wedge pattern. this means the price can range in this pattern until a break out happens! there is a Bullish Cross as well! you can see That the MACD line has just crossed the Signal line and that's a Bullish Sign! so we can say that ZIL is on it's way to 0.12$ and might reach it soon!
summery:
-ZIL is in a Broadening wedge
-Bullish Cross on MACD is a Pretty Good Bullish Sign!
-ZIL might reach 0.12$ soon!
💎Traders, if you liked this idea or have your opinion on it, write in the comments, We will be glad.
Thank you for seeing idea .
Have a nice day and Good luck

$ZIL CORRECTIVE TRIANGLE WAVEcompleted triangle
heading in the direction of continuation after holding support and breaking the compressed structure

Divergence BUT strength... Last moveFolks,
As we see bitcoin price gearing up for a ' last' move to $49K we see other crypto's also gearing up for a move..
double top was a correction did follow but that white long lower wick candle show me strength by the bulls and reject lower prices.
I ' think' we are up due to a lost move (also in Bitcoin --> $49K) before correction 20/30%. I am not predicting anything NO.. But wouldn't be logic that some whales in Bitcoin take profit..
and prices around $50K (crypto loves round prices) would be logic.. So they let the market fall down and give them selves another opportunity to buy in again at lower prices...
That's how It works and we have to accept it.
This was me just thinking a little loud.. BUT HÉ I DEFINITELY CAN BE WRONG!!!!

Reverse thinking on ZilliqaFolks,
Here you see a nice uptrend line that is making higher highs and higher lows.. When you don't how to target an eventually target price..
Just think in reverse.. What do you do know??
Well the price test the uptrend multiple times.. The pattern I see is that when it raises again it makes around the 20% gain before testing the trend line again and reverse in price again.
When it gets up (the price) it raises again around the 20%.... And so on and on..

Where is ZIL headed to? After a major correction, usually , ZIL goes through an uptrend channel before a major move to the LOG trend line of the previous high.
Will we see the same story happening this time ?
Any trades initiated right now should have a stop loss at 0.09 usd.
Price target : 0.5 usd
Please see my previous analysis on ZIL:
Follow me for more updates ;)

ZIL - ZilliqaIt has a good movement shape for breaking its 70-day resistance.
If the high price of the Ichimoku cloud stabilizes and due to the formation of the green cloud and the ascending shape of the Ichimoku and other cases, this resistance will most likely be broken in a short period of time.
Target are available in the short term
In the long term, the target is 40 cents

Zilliqa formed bullish BAT for up to 53.5% profit moveHi dear friends, hope you are well and welcome to the new update on Zilliqa (ZIL) coin.
Previously we had a very nice trade of Zilliqa coin:
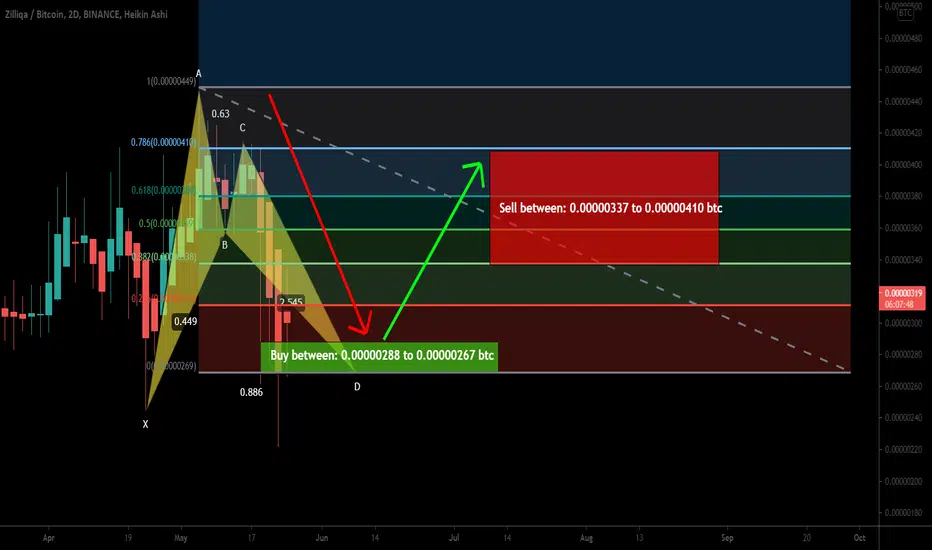
Now on the 2-day time period chart, the ZIL has formed a bullish BAT. After visiting the buying zone the priceline has moved above this potential reversal zone area, but we may have another chance to catch it from the buying zone.
Buying and sell targets:
Buy between: 0.00000288 to 0.00000267 btc
Sell between: 0.00000337 to 0.00000410 btc
Stop loss:
The maximum extent of buying zone can be used as stop loss, that is: 0.00000267 btc.
Possible profit and loss ratio:
As per the above targets, this trade has a big profit possibility of 53.5% and the loss possibility is 8%.
Note: Above idea is for educational purpose only. It is advised to diversify and strictly follow the stop loss, and don't get stuck with trade
Zilliqa Aug. Price Prediction Here are my 3 Price Predictions heading into September.
Bill gets drug out we may see a consolidation phase kick in & slow us down, would leave us around .0000025 price range.
Once clear of the bill we will see a nice pump with a large pull back to cool off, should be sitting around .0000032 price.
Say we get clear of the Bill & Mass Adoption kicks in, we may see a similar spike as we did just before 2021. If duplicated we could reach .0000040 then have a slight pullback & end up at .0000038+ heading into September.

ZIL Above the Clouds. Slow, Methodical Gains. Stake it ALL!Really bullish on ZILLIQA. Great infrastructure and team. Waiting for alt season to kick in and ZIL will go gangbusters. Near term target set at .13. Once this level has been breached prepare for a continued bull run to previous ATH and beyond. Connect your ZILPAY wallet to ZILLION for a multitude of staking option. Enjoy the ride.

ZIL/USDT (add to watchlist)ZIL / USDT
Price is testing strong resistance almost in all time frames
Buy only after breakout of resistance zone
(Never long below resistance)
Support zone must hold to remain bullish
Best of luck 🤞

Long ZilliqaAs per ichimoku cloud, Zilliqa is trying to break 0.085 ~0.09 resistance.
We can see the price is traversing the bearish red cloud, our blue conversion line gave us a possible entry signal since it crossed the base red line.
The lagging yellow is going up to further provide a strong long signal.
Waiting for the new green bullish cloud for form on the daily.
Short term : break 0.09 and flip it for support
Medium term: 0.12 to 0.14 cents
Long term: 0.25

ZILLIQA ON INTERSTING INCREASE TREND - LONG TRENDHello trading friends,
Zilliqa shows the interesting trend for a possible increase trend from 0,0800
Possible breakout with a higher time frame.
✅Like and subscribe to not miss a new idea!✅ Thank you
# Manage always your risk, nobody knows the future - all depending on Data, trends, and whale effect
All our charts are not advice and you are responsible for your own investment


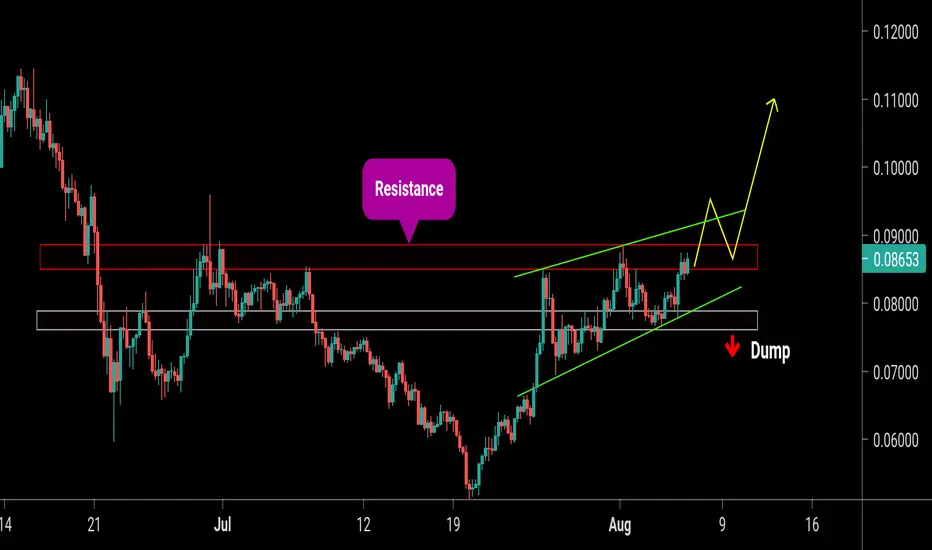
Zilliqa be ready for war!!Hi Folks,
Zilliqa has made a nice little rally last days.. But what we see on the 4 hour chart price is hitting resistance and got rejected again.
This has been the 3rd time in the last 5 days.
We see momentum in a rising trend channel.. We still make higher highs and lows in the momentum so the trend can be seen as bullish..
Except we need to be cautious now because of resistance line that got rejected.
Chance is to fall back at 1st or maybe 2nd support line and try to gain momentum again and try to go to war to breakout at resistance line.
Where I put my flag on the momentum oscillator is the signal to sell if you have a position in Zilliqa..
Most people want to know when to get in a trade, when is the right time to buy, they ask a lot.
Less important point in trading you'll see is the moment of stepping in. Ask yourself when do I need to get out?
Where is my stop loss or when I am wright where do I take profits?
My philosophy in trading = I see trading as going to a party. I arrive fashionably late and I leave before the cops come.
So in context with trading... I don't need to find the bottom In a trade.. no I buy high and sell even higher (before decline in price)

ZILETH Has Formed a Flag
Welcome back Traders, Investors, and Community!
Hi Traders, ZILETH on H4 if it breaks above the Resistance it could go higher.
⬆️Buy at FLAG Breakout or Buy at 0.00003055
⭕️SL @ 0.00002789
✅TP1 @ 0.00003820
✅TP2 @ 0.00004520
✅TP3 @ 0.00005619
We will have more FREE forecasts in TradingView soon
❤️ Your Support is really appreciated!❤️
Have a Profitable Day

Watch for inverse head and shoulders on ZILChart shows daily inverse head and shoulders possible. Just something to start watching for. My buy in and profit taking target are shown.

Next stop : 3usdWe are finishing wave 4 and we are about to start the major wave 5. This wave, in my opinion, it will be the longest and most powerful.
Check the zil/btc chart and you will how bullish this coin is.
Cheers!

ZILUSD Touching TrendlineAn idea for ZIL
Green dotted line is the trendline being touched
This will hold as per fib circle touch also
Likely will result in an inverse H&S and then further upward movement
Which I have plotted with the green Bars Pattern
