Zilliqa


ZIL/USDT - Update - Cypher still can be OK - LONG"I think Zilliqa is on it's way to reach a next high, but let's just place our target a bit closer first .
After a quite hard consolidation, it's completed a cypher pattern on 1D chart, which gives us the opportunity to open some long positions, in my opinion.
Yeah volume should be a bit more significant.. anyway I like this pattern."
- related previous idea -
By the crash the stoploss closed my last trade in my related previous idea, but I redrew the cypher pattern and I still think it fits to the LONG prediction, with new TP and SL ofcourse..
We'll see!
LONG
All feedbacks are appreciated!

Eyes on Zil | 400% potential | Long | ZilBtc$Zil
Daily
Green = Resitance
Red = Support
*PA Found resistance turned to support & staying above 20,50,100,200 EMA .
Looking very good.
Market Cap: $2,301,947,349
24 Hour Trading Vol:$1,074,306,514

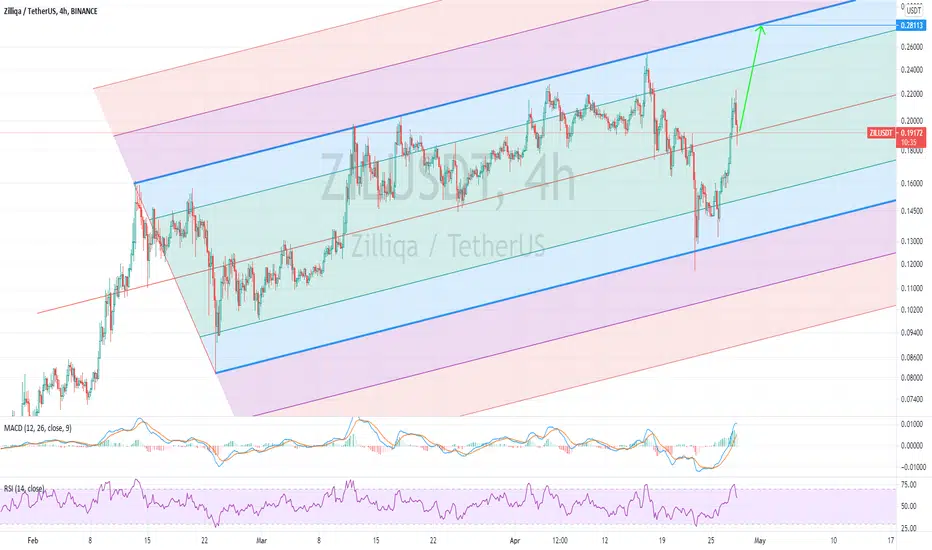
$ZILUSD - Possible jump to 0.28Hello everyone!
Zilliqa set a new ascending channel and looks like to hit $0.28
ZIL to $0.30!Zilliqa has shown signs of rejection around the 61.8 fib level and price has rapidly pushed on from there. We expect price to reach $0.30 creating new ATH!

ZILUSDT 1HZil broke the falling trend which is above the strong support zone. It has minor resistance, I showed these resistances in the chart by price tag.
Exceeding these resistances will affect the price positively.

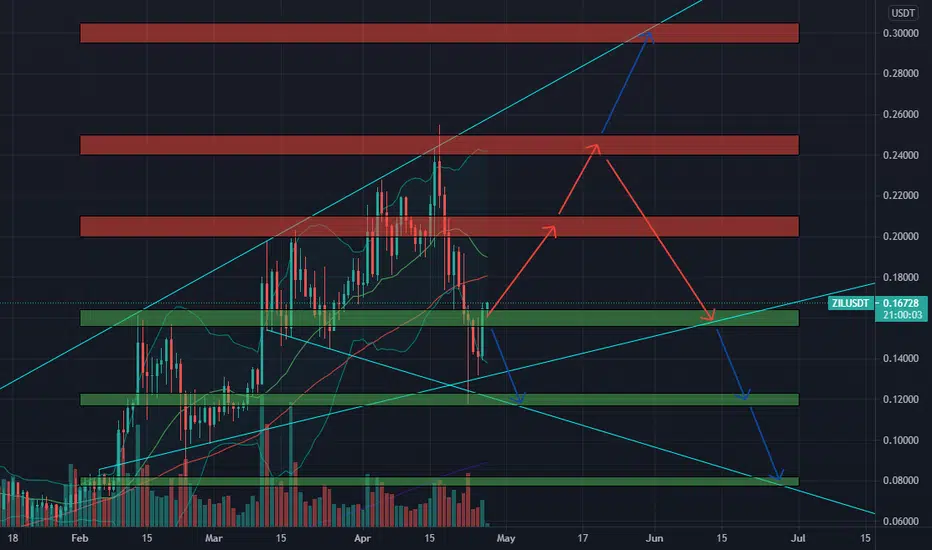
🆓Zilliqa/USDT Map (27/4) #ZIL $ZILZIL has just conquered the 0.16$ zone and is heading to 0.2$ and 0.25$ zone.
📈BUY
-Buy: 0.156-0.164$. SL B
📉SELL
-Sell: 0.20-0.21$. SL A
-Sell: 0.24-0.25$. SL A
-Sell: 0.295-0.305$. SL A
♻️BACK-UP
-Sell: 0.156-0.164$ if B. SL A
-Buy: 0.117-0.123$. SL B
-Buy: 0.078-0.082$. SL B
❓Details
🕯Timeframe : 1D
📈Red Arrow : Main Direction as BUY & SELL section
📉Blue Arrow : Back-Up Direction as BACK-UP section
🟩Green zone : Support zone as BUY section
🟥Red zone : Resistance zone as SELL section
Zilliqa (ZIL) - April 25Hello?
Dear traders, nice to meet you.
By "following" you can always get new information quickly.
Please also click "Like".
Have a good day.
----------------------------------
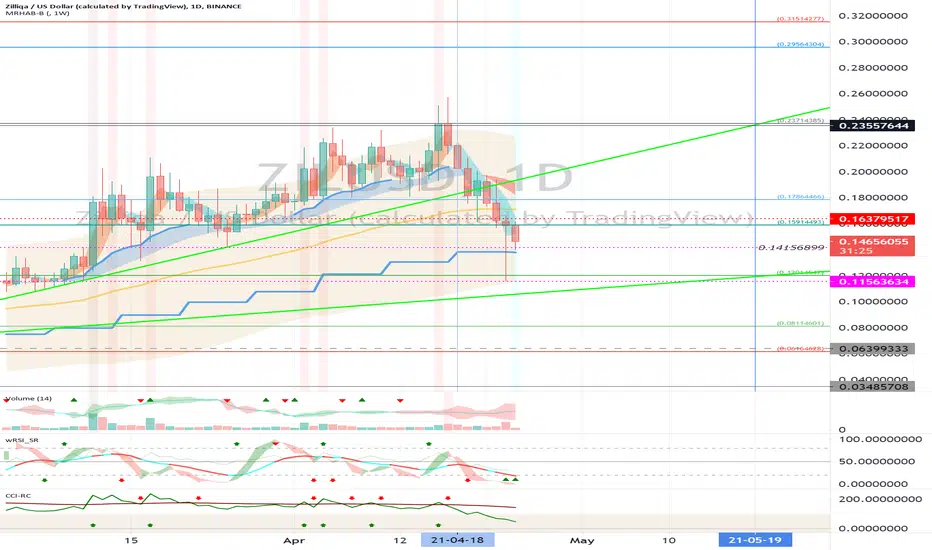
(ZILUSD 1W chart)
In order to continue the uptrend, it needs to be supported at 0.14156899.
(1D chart)
We have to see if we can get support at 0.14156899 and climb to the 0.15914493-0.17864466 range.
In order to turn to an uptrend, it must rise above 0.17864466 points and gain support.
If it falls at 0.11563634, you need a Stop Loss to preserve profit or loss.
However, you can touch the 0.06399333 point and climb, so you need to think about how to respond.
----------------------------------
(ZILBTC 1W chart)
In order to continue the uptrend, it needs to be supported at the 287 Satoshi point.
(1D chart)
We have to see if we can get support at the 287 Satoshi point and climb above the 298 Satoshi point.
If it falls at the 262 Satoshi point, Stop Loss is needed to preserve profit and loss.
However, you need to trade carefully as you can touch and climb the 191 Satoshi point.
--------------------------------------
It is advisable to trade at your average unit price.
This is because if the price flows below your average unit price, which was on an uptrend or downtrend, there is a high possibility that you will not be able to earn a large profit due to the psychological burden.
The center of every trade starts with the average unit price you start trading.
If you ignore this, you may be trading in the wrong direction.
Therefore, it is important to find a way to lower the average unit price and adjust the proportion of the investment, so that the money that ultimately corresponds to the profit can regenerate the profit.
-------------------------------------------------- -------------------------------------------
** All indicators are lagging indicators.
So, it's important to be aware that the indicator moves accordingly with the movement of price and volume.
Just for the sake of convenience, we are talking upside down for interpretation of the indicators.
** The wRSI_SR indicator is an indicator created by adding settings and options from the existing Stochastic RSI indicator.
Therefore, the interpretation is the same as the conventional stochastic RSI indicator. (K, D line -> R, S line)
** The OBV indicator was re-created by applying a formula to the DepthHouse Trading indicator, an indicator that oh92 disclosed. (Thank you for this.)
** Check support, resistance, and abbreviation points.
** Support or resistance is based on the closing price of the 1D chart.
** All explanations are for reference only and do not guarantee profit or loss on investment.
Explanation of abbreviations displayed on the chart
R: A point or section of resistance that requires a response to preserve profits
S-L: Stop Loss point or section
S: A point or segment that can be bought for profit generation as a support point or segment
(Short-term Stop Loss can be said to be a point where profits and losses can be preserved or additionally entered through installment transactions. It is a short-term investment perspective.)
GAP refers to the difference in prices that occurred when the stock market or CME and BAKKT exchanges were closed because they are not trading 24 hours a day.
G1: Closing price when closed
G2: Cigar at the time of opening
(Example) Gap (G1-G2)
ZIL/USDT - a quick but LONG Cypher bounce!I think Zilliqa is on it's way to reach a next high, but let's just place our target a bit closer first .
After a quite hard consolidation, it's completed a cypher pattern on 1D chart, which gives us the opportunity to open some long positions, in my opinion.
Yeah volume should be a bit more significant.. anyway I like this pattern.
We'll see!
LONG
All feedbacks are appreciated!

#ZIL Ideal buying opportunity. Its a steal. Trend line hit on Daily. MACD should look more favourable after this big dip. RSI oversold. Good times ahead for Zilliqa.

ZILLIQA WILL BE A ROCKET THIS YEAR!!! MOON MOON MOONMuch attention, zilliqa is one of the best projects on the market. The price is super undervalued right now, it's probably a rocket to the moon. Also, the team is very big and smart, the USD price is almost at highs and ready to hit $ 1 very soon. I'm not going to miss this moon rocket. See you on the moon.

ZIl Triangle Zil is doing great if you look at the facts. Lots of dev, building bridges and they are burning lots of zil. The Btc dominance is under 50 soon so Zil is gonna pop.

Ziliqa Sitting PrettyZilliqa (ZIL) was developed in the year 2017. It is a high-throughput public blockchain platform designed to scale to thousands of transactions per second and the project was created to deliver performance, scalability, and security.
Zilliqa is mainly based on the concept of Sharding and aims to enhance the scalability of other cryptocurrency networks. It is extremely fast, secured and decentralized. Zilliqa’s high throughput aims to solve the problems of network congestion, high transaction fees and security which are the key issues with legacy blockchain platforms.
The project has established partnerships in digital advertising (Mindshare), financial services, payments, gaming, as well as digital entertainment.
Scilla, short for Smart Contract Intermediate-Level Language is an intermediate-level smart contract language developed for Zilliqa. This language was developed in order to improve security and offer a robust environment for the deployment of smart contracts and dapps. In August 2019, Scilla was peer-reviewed and accepted at one of the most prestigious programming languages conferences - OOPSLA 2019.
Ziliqa is currently awaiting approval with the Monetary Authority of Singapore (MAS) to partner with Hg Exchange, Southeast Asia's private exchange formed by an alliance of leading financial intermediaries and individually licensed and regulated by the Monetary Authority of Singapore (MAS). Hg Exchange will make equities trading more efficient and transparent. This will be Zilliqa's first enterprise-ready project to use smart contracts to represent digital assets. This could be big!
Ziliqa has a circulating supply of 12 Billion ZIL coins and a max supply of 21 Billion. The market cap is currently $2.1 billion. HitBTC is the current most active market trading it but the token trades on many exchanges including Binance. Non-custodial staking of $ZIL in wallets is now available in Phase 1. The APY for non-custodial staking will depend on the total amount of $ZIL in circulation being staked. According to their website 'if 80% of the total amount of $ZIL in circulation is staked, users can expect an APY of approximately 6%'.
I went long ZIL/USD on 08 March at $0.12. ZIL/USD reached an all-time high of $0.25 on 17 April 2021 (5 days ago). The price has pulled back -28.7% yet ZIL/USD is still in a clear uptrend. ZIL has found support on a rising 50 SMA . Both the 50 SMA and the 100 SMA are on the rise since late November 2020. Here is an opportunity to go long ZIL/USD after this recent cool off.
www.zilliqa.com


ZIL/USD: The MOST BULLISH COIN in the Crypto MarketFUNDAMENTALLY: Zilliqa's blockchain was born in Singapore the finance hub of Asia. This hypes the possibility of it being the most likely coin to be adopted regionally. It's blockchain uses a SHARDING technique very similar to the concept of DIVIDE AND CONQUER when mining, any time ANY investor sees the words divide and conquer to solve millions of problems (mining) they will bet on it over most other methods.
TECHNICALLY: 4 bullish patterns indicate an upcoming breakout. 1)Adam and Eve double bottoms; 2) 1st Bullish Gartley pattern and then 2nd currently half formed; 3) Pennant; 4) The Big Ws, consistently.


Zilliqa consolidating to the upside 4x potential short term
Zilliqa staking is a 15-23% APY
Some wallets reward you with gZIL
the governance token
supply cap of about 600k
thats 35x smaller than bitcoin's 21M
NEVER FINANCIAL ADVISE

My vision for zilliqaAll details are marked on chart
This is an investment deal so pls put what you can afford to lose

Zilliqa: Triangle and Trading-Range #ZILUSD - is in a trading range and triangle. The good thing is that $ZIL is pushing through its uptrend. A breakout above the $0.21 - $0.22 area could continue the uptrend and activate the next price target at $0.26.
#Zilliqa

ZILUSDT in ascending channelDaily timeframe shows ZILUSDT has been moving up and up in an ascending channel for over two months! So I pick it on MA10 MA21 and support line of the channel. It could easily bring considerable profit.
Trade Safe
