💡Don't miss the great buy opportunity in ZILUSD @zilliqaTrading suggestion:
". There is a possibility of temporary retracement to the suggested support line (0.1200).
. if so, traders can set orders based on Price Action and expect to reach short-term targets."
Technical analysis:
. ZILUSD is in a range bound, and the beginning of an uptrend is expected.
. The price is above the 21-Day WEMA, which acts as a dynamic support.
. The RSI is at 63.
Take Profits:
TP1= @ 0.1555
TP2= @ 0.1830
TP3= @ 0.2070
TP4= @ 0.2275
TP5= @ 0.2560
SL= Break below S2
❤️ If you find this helpful and want more FREE forecasts in TradingView
. . . . . Please show your support back,
. . . . . . . . Hit the 👍 LIKE button,
. . . . . . . . . . Drop some feedback below in the comment!
❤️ Your Support is very much 🙏 appreciated! ❤️
💎 Want us to help you become a better Forex / Crypto trader ?
Now, It's your turn !
Be sure to leave a comment; let us know how you see this opportunity and forecast.
Trade well, ❤️
ForecastCity English Support Team ❤️
Zilliqausd


$ZILUSD - Could jump anytime soonHello everyone!
I'm bullish on Zilliqa, believing that the coin will continue the uptrend inside an ascending parallel channel.


Zill following ENJ - ENJ leading next altcoin rallyCalled the ENJ pump nicely; sold too early *doh
Zill following ENJ - ENJ leading next altcoin rally
RATIO RATIO RATIO
note zill seems to be half on each step; which gives you that next target on zil 100% up from here. further pump incoming.

It's Time to Buy Zilliqa 62% soon 🔥 ZIlliqa Break Resistance around 0.15 and retest 6 Time So now it's time to bull run next Target is 0.23 🔥
Please don't forget support us : Like , coment , Follow


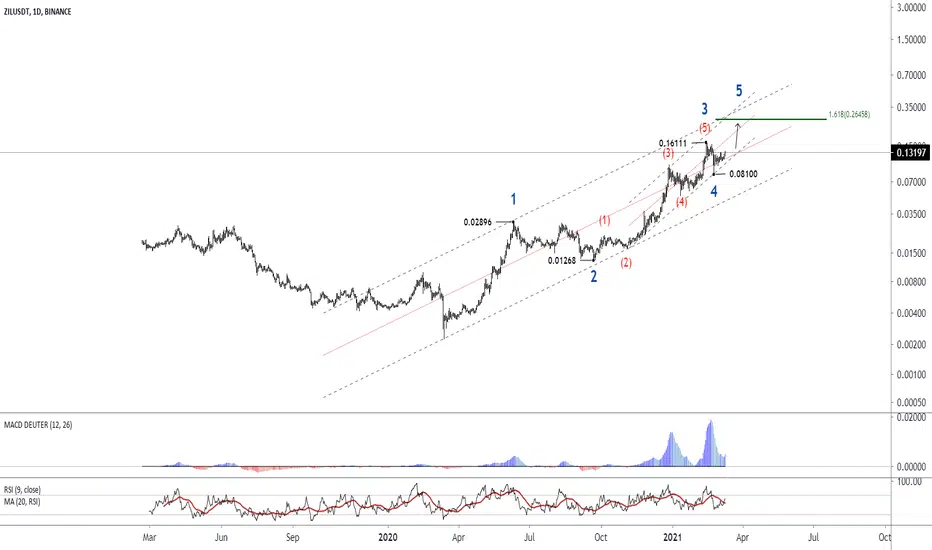
The end of wave 4 and the beginning of the 5th uptrend wave 5 According to the wave count done in the daily chart, wave 4 has ended in the range of 0.081 and the 5th wave has started, which the targets of this uptrend are in the range of 0.26 to 0.35.
Zilliqa Price Dips for me - Based on MACD + levels . DYOR DCA inJust using measured MACD crossings to determine possible price lows (which precede the crossover on the MACD). Lower buy zone is based on an order block(where price sprinted away from 0.8cent range).

Zilliqa is going towards 0.15$I expect we reach 0.15 26-27th
BTC is going up towards 54k lvl or even 57k thanks to that Zilliqa will go up towards previous highs, This TP and resistance levels are in for now, Trade safe

ZIL breakout expected Wed, 24-Feb. I believe the .1655USD line of resistance will hold forcing ZIL into tightening wedge. I expect it will have to decide on wednesday what to do. Based on all the bullish signals, I'd have to go with a break up forming a new line of consolidation just under .18 USD. Thoughts?

ZIL to .145usd by Saturday, 19-Feb looks solidCan ZIL hit .145USD tomorrow (sat, 19-feb) and stay above. hope so! this would be a good support level for testing ATH next week. Looks very possible. Thoughts?


ZILUSDT breaking out of consolidation. Waiting for daily close.A nice textbook setup forming for this coin. Needs to be confirmed but looking good so far.
Market has been all sideways lately so watch out for more of that (e.g. false break). Assuming this breakout is strong, one may expect the current candle to close near its high and a nice follow through candle tomorrow. A re-test of the trend line support is also a valid price action in a bullish breakout scenario.
Not trading advice.

ZILLIQA ZILUSDT BREAKOUTthe breakout will soon be eminent, once it occurs we can see a possible retracement back down before a new ATH is achieved at the regions on the chart.


ZILBTC has confirmed a big breakoutBull flag and down channel:
On daily time frame chart, the price action of Zilliqa has formed a bull flag. This flag is in fact a down channel. Within this channel the price action has broken down the daily EMA 10 and 21 but having bounce from the support of channel. The volume is also decreased.
SMAs on daily chart.
On daily chart, the price action of Zil has broken down the 25 SMA and having good support of 50 simple moving average. The 50 SMA is at the same level where we have the support of the down channel.
EMAs on weekly chart.
On the weekly time period chart, the price action is testing exponential moving average 10 as a support.
Break out the down channel:
Now if we switch to the Zilliqa with Bitcoin pair, then on long-term weekly chart, it can be seen that the price action has broken out the down channel and after re-testing now the price action is likely to move up. It is quite good confirmation of a firm break out.
Conclusion:
On daily chart, the price action is behaving like a bull flag and in Bitcoin market it has broken out the big channel on long-term. Therefore it can be possible that now the priceline of Zilliqa will start a major move to the upside from here.

ZILLIQA DAILY CHARTS- In this chart we can see the possible options
of movement. We can see that the price can break the flag. If the price goes back, we could look for incorporation in the bearish divergence.
- The other option is that the price breaks down and we could look for support in the support marked as a rectangular area. This is a relevant volume area and it is possible that the price will return to it, which would be a great opportunity to buy if confirmation is given.

ZILLIQA WEEKLY CHARTSIn the weekly chart we see how a turning pattern marked by a semicircle has been formed. We see that the price breaks through the resistance area with a lot of volume and today the price is forming a bullish flag, indicating that a continuation pattern is likely. We see in more detail how we could take advantage of the movement in the daily chart.


ZILBTC a mega bullish setupHey friends, hope you are well, and welcome to the new update on Zilliqa coin.
Bull flag and re-testing of a EMAs:
In USD market, on the daily time frame chart, the price action of Zilliqa has formed a bull flag and moving in a down channel. In the meanwhile, it is also using exponential moving averages with the time period of 10 and 21 as support.
Down channel has been broken out:
On the long-term weekly chart, the price action of Zilliqa coin with Bitcoin pair was moving in a down channel. Now the price line has broken out the resistance of this channel and re-testing the previous resistance as support to confirm this breakout. We also have 25 and 50 simple moving averages as support at the same level of support of the channel that was previously working as resistance. The 25 SMA also formed a bull cross with 50 SMA as well.
Ichimoku bearish cloud broken out:
On the same long-term weekly chart, in Bitcoin market the price action of Zil has also broken out the Ichimoku bearish cloud and now re-testing the previous resistance of cloud as support to confirm this breakout.
Big Shark move:
On the long-term monthly time period chart, the price action of the Zilliqa with Bitcoin pair has completed last leg of bullish Shark pattern and entered in potential reversal zone. 1st the priceline found a support at 0.00000050 btc and then found another support at: 0.000001150 btc . Simple moving average 7 is forming bull cross with SMA 25.
Conclusion :
As the priceline of Zilliqa has completed a very firm bullish setup in the Bitcoin market to move up against the BTC. Therefore, there are strong chances that the Zilliqa will also cross the previous high that Zilliqa set in the previous bull run.
For exact buy and sell targets for this trade, and other harmonic trading signals you can join:
www.patreon.com
