Zilliqa ZIL Price Targets and Stop LossZIL/USDT
Entry Range: $0.075 - 0.081
Price Target 1: $0.091
Price Target 2: $0.100
Price Target 3: $0.111
Stop Loss: $0.065
Zilusd

ZIL/USDT : Reached channel's top! BINANCE:ZILUSDT
Hello everyone 😃
Before we start to discuss, I'll be so glad if you share your opinion on this post's comment section and hit the like button if you enjoyed it!
$ZIL has formed a descending channel and it has reached the channel's top.
Despite the current market's bias, I'm expecting more corrections to come; Because of the recent bounce without any retracement.
In macro overview, It must come with a fake-out above the channel and experience the rejection from the higher resistance zone at $0.11.
So based on the data we have, There'll be opportunities to take Short on...
- On the rejection of $0.11's resistance zone and current rejection from S/R line and channel's high.
- On the proper retest of broken lower S/R zone at $0.85.
🔴 Invalidation should be located as active management above the higher resistance zone.
Hope you enjoyed the content I created, You can support us with your likes and comments!
Attention: this isn't financial advice we are just trying to help people with their vision.
Have a good day!
@Helical_Trades des

ZILUSD Perfect buy level for a complete recoveryZiliqa (ZILUSD) is rebounding after almost hitting the former Lower Highs trend-line, which happens to be just below the 1D MA200 (orange trend-line). The pattern is quite similar to the late February - mid March 2020 COVID market crash. Even in RSI terms, the sequences are fairly identical. As long as the former Lower Highs hold, we are expecting a strong recovery back to the April 01 High, even the 0.2650 High of May 2021.
--------------------------------------------------------------------------------------------------------
Please like, subscribe and share your ideas and charts with the community!
--------------------------------------------------------------------------------------------------------

$ZILUSD - RSI straddling the middlezone.March 22 was a great month indeed, as ZIL-KRW pairing pushed price action from the doldrums into the stratosphere.
Then April came and took the wind out of ZIL's sails and price dumped hard.
But not hard enough, as evident by the retracement not meeting March's starting point, despite near similar volume.
While it would be tempting to call in a bear market, RSI is straddling the middlezone, around 50, and until it dips, there is still a good chance the the bulls will step in and push price higher, which seems to be the likelier path of least resistance in this Elliot Wave 3 uptrend analysis.

$ZILUSD - Accumulation & DistributionA summarised understanding of Zilliqa's $ZIL accumulation and distribution events taking place.
Accumulation 1: 33.2B moved.
Accumulation 2: 61.9B moved.
Distribution 1: 23.1B moved.
A simple takeaway here is that we're seeing a decrease in the movement of $ZIL, which to me is a bullish sign aka hard core hodlers aren't bulging, while profit takers are profit taking, and there will be a point where they'll realise it's time to stop profit taking and let price appreciate, so that they can profit take later~

ZIL - DCA-ZONEHey Guys, if you are interested, this are my DCA-Zones at ZIL.
▶DCA-Buy-Zones:
- 0.03733 bis 0.04533
- 0.06360 bis 0.07526
▶Lower Support:
- 0.02118
NO FINANCIAL ADVICE | DYOR | HAPPY TRADING

$ZIL CRYPTO WINTER SCENARIOis it possible we are in for a crypto winter?
if so then the alt season could be on hold for as much as another year!
the good news is that if it does take that long, then the prices can go much higher.
$5.00 for zilliqa in January 2023
I am not selling positions, just accumulating.
not financial advice

ZIL 1 hr time framedouble top and double bottom. plus divergence coming
my 1st trade point = 0.10300.

ZIL/USDT ANALYSISZIL earlier took a massive bull rally due to it's fundamental news. Currently, price is dumping and build up a resistance at $0.134 - $0.138. Price reached a support level of $0.096 - $0.10 and price breaks below this level in 4H TF, then we can continue fall till next major support zone of $0.033 - $0.042.


Zilliqa (ZIL) breakout is a'happenin!We may see some resistance at the weekly neutral pivot... however there's a lot of activity buzzing in the background, and orders are coming in like Dirk Diggler a third of the way through the film "Boogie Nights".
Enjoy guys.
♠️🤫🐿

$ZIL LONG ZILUSDT I think $ZIL needs 1 retest of the top, can break out of the nearest top, and get to the 0.3xx area in a short time, you can enter a long position at the $0.11xx price zone.


Zilliqa ZIL short Price Targets and Stop LossZIL/USDT short
Entry Range: $0.103 - 0.111
Price Target 1: $0.0980
Price Target 2: $0.0890
Price Target 3: $0.0800
Stop Loss: $0.120
Previews BUY
Previews SELL

Zilliqa still got some juice leftforming a rounded bottom with RSI bullish divergence in 1 h to 4h .
Seems like all set for a reversal. Will it continue and break all time high? That we will have to wait and watch
Cheers
-Nav

ZIL/USDT (Zilliqa) - Bullish Double-Bottom Support, Momentum 4HRZIL/usdt (Zilliqa) crypto price has double bottomed above 0.1220 in the 4-hour chart.
Bullish momentum has also formed on the MACD indicator (4hr).
Entry (long): $0.1324
Take Profit +18% (exit: $0.1564
Stop Loss -9% (exit): $0.1204
Note: Zilliqa price may pullback down intraday (shorter-term time frames) before this 4-hour setup rallies up.
Support needs to hold above 0.1200 or this chart setup could be stopped out.
Resistance needs to break and hold above 0.1350 to validate the pattern and potential rally.
All content is Not financial advice. Trade at your own risk.

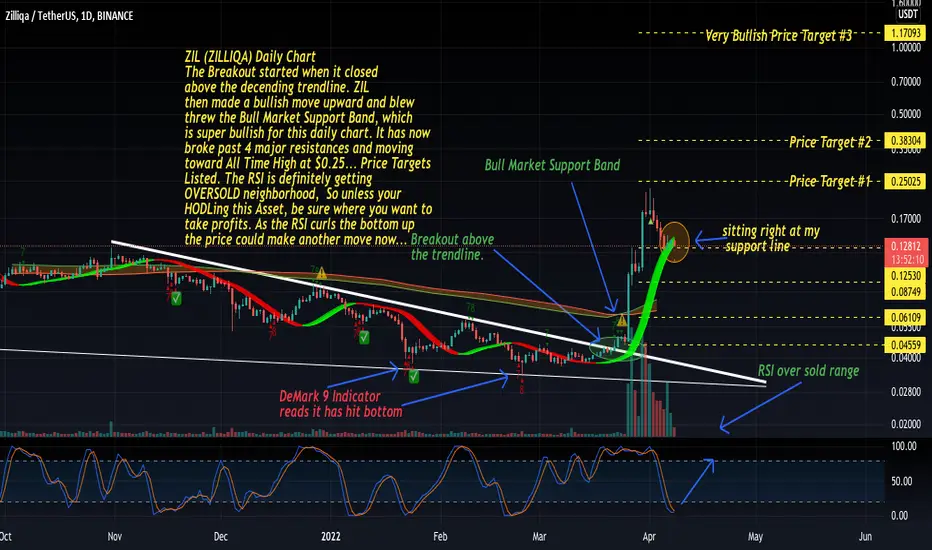
ZIL daily chart has cooled off & could make another push upwardZIL (ZILLIQA) Daily Chart
The Breakout started when it closed
above the decending trendline. ZIL
then made a bullish move upward and blew
threw the Bull Market Support Band, which
is super bullish for this daily chart. It has now
broke past 4 major resistances and moving
toward All Time High at $0.25... Price Targets
Listed. The RSI is definitely getting
OVERSOLD neighborhood, So unless your
HODLing this Asset, be sure where you want to
take profits. As the RSI curls the bottom up
the price could make another move now...
ZIL Breakout???We could be having a bit of a breakout for ZIL right now.
Going to be some heavy resistance coming most likely though, right around ~T0.135 - T0.1375

$ZILUSD - Wants to break this resistanceHello everyone!
Zilliqa hit this dynamic resistance 3 times already.
Now it has tested an important resistance as support and looks to break the upper border of the downtrend channel.

Zilliqa (ZIL) gotta love bullish math.I realize that ZIL may wobble a bit here and there over the next several hours, maybe a day or more. However, from the simple mathematical chart that I've thrown together here, I think we could be in for a good rise if we can just push past that heavy resistance level at about ~T0.1375.
I've assembled this chart to try and be a simple as possible when conveying mathematical charting. There is obviously more that goes into this, however for right now-- this rule of thirds is always something to look for when on an hourly/4hour resolution. More to come on my channel.
I feel that ZIL, ETH and many other tokens are currently VASTLY undervalued. Bottom, basement prices. Like I said...
Patterns, baby.
♠️🤫🐿

Zilliqa ZIL Price Targets and Stop LossZIL/USDT short
Entry Range: $0.129 - 0.139
Price Target 1: $0.121
Price Target 2: $0.111
Price Target 3: $0.103
Stop Loss: $0.154
All targets reached

ZIL : A Trade ideaZilliqa (ZIL/H1)
#ZIL is already down by 42% Since the recent pump and is consolidating inside a falling wedge. Will long some #ZIL if the Conditions happen :
1 - Downtrend line gets broken upwards📈
2 - Super trend indicator gives "Buy" Signal in the 1H Chart.📈
