ZIL - ABCDE CorrectionZIL potentially will spike up from the correction . This is going to be pretty huge!
Zilusd

$ZIL MOMENTUMmacd momentum is positive
price above 18 ma
wave 5 to challenge all time high
months to play out
not financial advice


Inverse Head & Shoulders Pattern!"Buy when there's blood in the streets" - Baron Rothschild
Last time to accumulate at these prices before it breaks all-time-high
I hope you found the idea interesting :)

zilusdthis is going to be pretty huge! watch these level as zil moves up in to the 20cent range
no trading advice

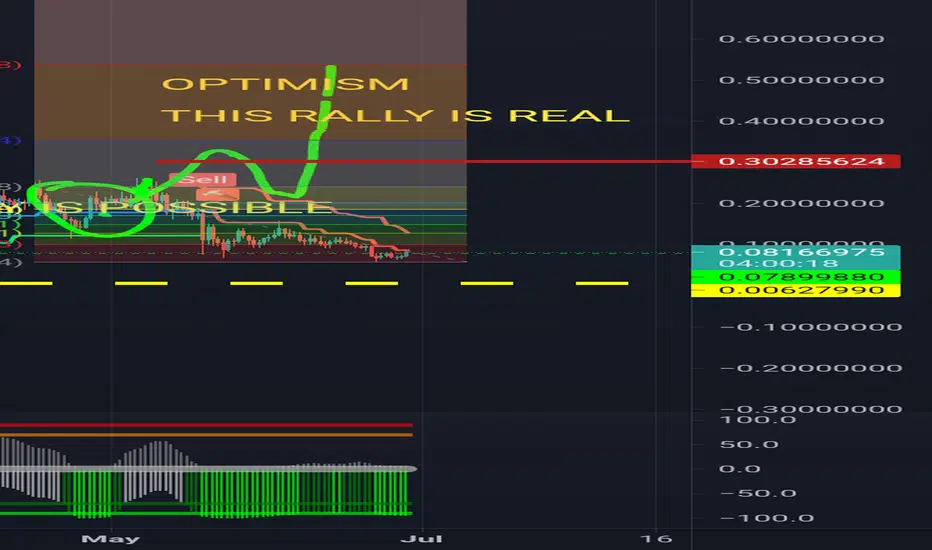
Zilliqa (ZIL) Price Prediction - Sleeping Giant?What I am seeing right now is that Zilliqa is about to follow the path of TRON, XLM, Sushi, and other assets which have already started their bullish cycles.


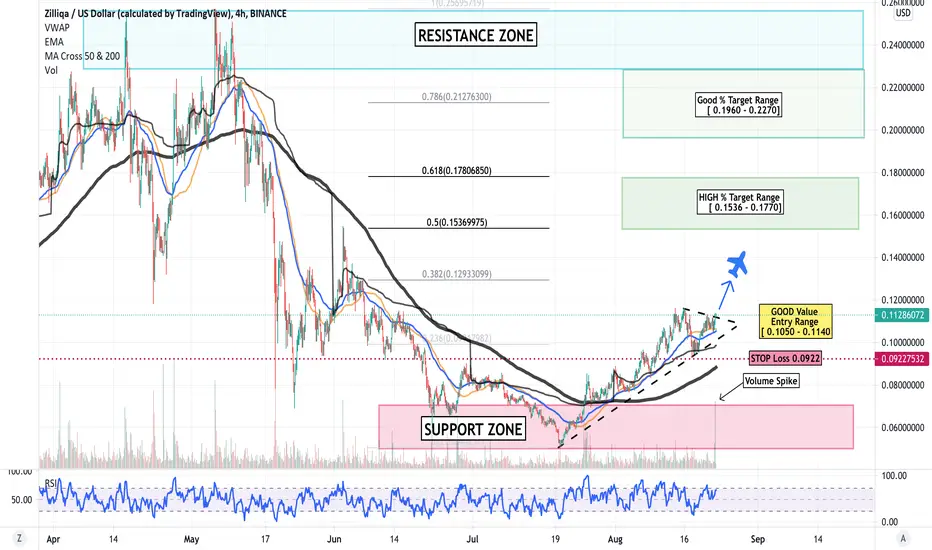
[ZIL] Zilliqa - BULLISH. About to pop with volume spike!ZIL is on the way up with a valume spike. A very nice trade set up currently
is ZIL gonna Reach 0.12$?probably!Hi every one
ZILLIQA / TETHERUS
ZIL/USDT has started to Range in a Broadening wedge pattern. this means the price can range in this pattern until a break out happens! there is a Bullish Cross as well! you can see That the MACD line has just crossed the Signal line and that's a Bullish Sign! so we can say that ZIL is on it's way to 0.12$ and might reach it soon!
summery:
-ZIL is in a Broadening wedge
-Bullish Cross on MACD is a Pretty Good Bullish Sign!
-ZIL might reach 0.12$ soon!
💎Traders, if you liked this idea or have your opinion on it, write in the comments, We will be glad.
Thank you for seeing idea .
Have a nice day and Good luck


ZIL Above the Clouds. Slow, Methodical Gains. Stake it ALL!Really bullish on ZILLIQA. Great infrastructure and team. Waiting for alt season to kick in and ZIL will go gangbusters. Near term target set at .13. Once this level has been breached prepare for a continued bull run to previous ATH and beyond. Connect your ZILPAY wallet to ZILLION for a multitude of staking option. Enjoy the ride.

ZILUSD H16: 150% gains BEST level TO BUY/HOLD(SL/TP)(SWING)Why get subbed to me on Tradingview?
-TOP author on TradingView
-2000+ ideas published
-15+ years experience in markets
-Professional chart break downs
-Supply/Demand Zones
-TD9 counts / combo review
-Key S/R levels
-No junk on my charts
-Frequent updates
-Covering FX/crypto/US stocks
-before/after analysis
-24/7 uptime so constant updates
🎁Please hit the like button and
🎁Leave a comment to support our team!
ZILUSD H16: 150% gains BEST level TO BUY/HOLD(SL/TP)(SWING)
IMPORTANT NOTE: speculative setup. do your own
due dill. use STOP LOSS. don't overleverage.
previously recommended buying low.
🔸 Summary and potential trade setup
::: ZILUSD 16hour chart review
::: THROWBACK INTO ACCUM RANGE
::: accumulation in progress now
::: 150% gains is not a typo
::: already BROKE OUT
::: MARKET BUY NOW / 400% upside
::: LONG RANGE OUTLOOKS
::: this is not for short-term traders
::: accumulation NOT COMPLETE YET
::: 150%+ gains still possible
::: currently trading near range highs
::: BUY/HOLD setup TP +150%
::: previously recommended buying low
::: up to 1000% gains possible later
::: SPECULATIVE SETUP
::: do your own due dill
::: and use proper risk management
::: TP bulls is +150% gains
::: details: see chart
::: SWING TRADE: BUY/HOLD IT
::: bull run not over yet
::: good luck traders!
::: BUY/HOLD and get paid. period.
🔸 Supply/Demand Zones
::: N/A
::: N/A
🔸 Other noteworthy technicals/fundies
::: TD9 /Combo update: N/A
::: Sentiment mid-term: BULLS
::: Sentiment short-term: PULLBACK/RANGE LOWS
RISK DISCLAIMER:
Trading Crypto, Futures , Forex, CFDs and Stocks involves a risk of loss.
Please consider carefully if such trading is appropriate for you.
Past performance is not indicative of future results.
Always limit your leverage and use tight stop loss.


ZILUSD Touching TrendlineAn idea for ZIL
Green dotted line is the trendline being touched
This will hold as per fib circle touch also
Likely will result in an inverse H&S and then further upward movement
Which I have plotted with the green Bars Pattern

ZIL falling wedge patternFalling wedge pattern only has 8% - 10% failure rate.
Good to enter on breakout with volume for confirmation.
###NOT FINANCIAL ADVICE###


ZILUSD Micro gains before macro gains. Great Ecosystem.Nicely undervalued project with a powerful ecosystem. Bullish in short and long-term. Go Zilliqa.

ZILLIQA clear skies ahead! First to spur!Good evening,
Buying pressure will start very soon. We're in for a beautifull 2nd bull season.
Enjoy.
The Weatherman

Is there a silver lining in $ZIL's clouds or just gloom & doom?NOT FINANCIAL ADVICE
Should we get bullish or do we stay bearish?
Let's take a dive on the Macro level for $ZIL using the Ichimoku Cloud indicator.
For the uninitiated on Ichimoku Clouds, Investopedia has a good introduction here .
With that out of the way, based on $ZIL's macro Weekly chart, here we consider the bearish and bullish signals from this indicator.
1. Price Action VS the Kumo Cloud.
Bearish: This week's candle is threatening to break into the Kump cloud and is within touching distance.
Bullish: It hasn't broken and trade inside the cloud! The near horizontal Kumo cloud means that $ZIL may have a few more weeks to stabilise and steer itself away from it.
2. Chikou Span vs Price Action.
Bearish: The lagging span descending towards historical price candles and crossing downwards is a bearish confirmation and usually a sign of exhaustion of an asset.
Bullish: As this is a lagging indicator, it could be nothing more than just a trend analysis rather than a prediction of future movements.
3. Tenkan Sen vs Kijun Sen
Bearish: Tenkan sen is threatening to cross the Kijun sen, especially if the crossing is below the Kumo cloud.
Bullish: No crossover is yet seen. Also, even if there is a crossing, it will occur way above the Kumo cloud.
4. The Kumo Cloud (Senkou Span A + Senkou Span B)
Bearish: A thin cloud means the support level of the Senkou Span A is deemed weak -- may break anytime.
Bullish: The cloud is widening at the ends, and as Span A moves further away from Span B, a strong trendy green cloud is created.
So what does all the above mean? Why am I dissecting both bearish and bullish scenarios here?
Quite honestly, I am still sitting on the fence with $ZIL here, especially with the diminishing volume.
While I use Technical Analysis to try to predict the path of least resistance for price movements, I am simply unable to put a pin on it today.
We may be at an inflection point, where the price is so sensitive that it could move either way at a moment's notice.
I would like to call it 'Price Fragililty', while some may prefer to call it 'Price Volatility'.
Where is the silver lining playbook when you need one, eh?
Until next time, happy trading~

$ZIL Wave II retracement may not yet be over~NOT FINANCIAL ADVICE
We may have not seen the worse part of this Wave II retracement, which looks like a 5-3-5 Corrective Waves ABC.
On the Daily charts, It does seem to confirm the completion of Wave A (5 impulse waves down), Wave B (3 corrective waves reversal).
While price action may have retraced (from ATHs) touching the expected 0.618 fib levels, but due to late 2020's insance parabolic bull run, an overcompensated corrective waves can be expected.
While there are no theories that confirms this, the tingling elliotician in me tells me that there is a good chance that we can anticipate an impulsive Wave C down, which is currently underway.
A decent price target of $0.058 means Wave II will retrace and touch 0.786 fib levels before making its way towards new ATH on a good Wave III towards the end of this year with a target price of $0.311 at least.
With such price targets, we are looking at a possible gains of 536% gains ($0.311/$0.058 * 100%).
Good luck with your trades~!

$ZIL bottomed, decent trade but missed the ideal entry$ZIL has made a double bottom and back above daily support. ideal entry would have been 10168 satoshis, but it still offers a decent risk/reward trade if taken now. Alternatively it's also possible to wait for it to retrace a bit which would define a higher stoploss and offer a better R/R (but more risky) trade
